

Abstract
Although human naturally occurring regulatory T cells (Tregs) may express either CD45RA or CD45RO, we find in agreement with previous reports that the (∼80%) majority of natural Tregs in adults are CD45RO+. The proportion of CD45RA+ Tregs decreases, whereas CD45RO+ Tregs increase significantly with age. Nevertheless, a small proportion of CD45RA+ Tregs are found even in old (>80 y) adults and a proportion of these express CD31, a marker for recent thymic emigrants. We found that CD45RO+ Tregs were highly proliferative compared with their CD45RA+ counterparts. This was due in part to the conversion of CD45RA Tregs to CD45RO expression after activation. Another difference between these two Treg populations was their preferential migration to different tissues in vivo. Whereas CD45RA+ Tregs were preferentially located in the bone marrow, associated with increased CXCR4 expression, CD45RO+ Tregs were preferentially located in the skin, and this was associated with their increased expression of CLA and CCR4. Our studies therefore show that proliferation features strongly in maintenance of the adult Treg pool in humans and that the thymus may make a minor contribution to the maintenance of the peripheral pool of these cells, even in older adults. Furthermore, the different tissue compartmentalization of these cells suggests that different Treg niches exist in vivo, which may have important roles for their maturation and function.
Natural regulatory T cells (nTregs), defined as CD4+CD25hiFoxp3+, play an essential role in the control of immune responses (1). They are crucial for maintaining peripheral tolerance and protection against autoimmunity, and they also modulate immunity to infections and tumors (1). Therefore, to maintain controlled immunity, it is paramount that this regulatory population is maintained throughout life. CD4+Foxp3+ Tregs are often considered to be a distinct lineage of thymic origin (reviewed in Refs. 2 and 3). However, the thymus involutes with age (4), which suggests that the number of nTreg might be reduced during aging. However, we and others have shown that Treg numbers are increased in older animals and humans (5–8). Hence, the number of nTregs throughout life must either be sustained through extensive proliferation or by generation from another, extrathymic, source, such as the CD4+ T cell responder pool (2, 3, 7, 9).
Most Foxp3+ Tregs (90–95%) in the peripheral blood of adult humans express CD45RO (10), suggesting these cells have been previously activated and induced to proliferate (11). In younger adults, ∼10% of Foxp3+ Tregs express CD45RA and are considered an unprimed or naive Treg population (12, 13). We have previously shown that CD45RO+ Tregs turnover very rapidly in both young and old donors and are susceptible to apoptosis and replicative senescence, indicating that they have a limited capacity for self-renewal (7, 10). Therefore, the inherent thymic involution suggests that nTregs may also be derived from other sources in adulthood. However, the source of nTregs in older subjects has yet to be fully delineated. Because CD45RO+ Tregs are the largest component of the adult Treg population (10), most work on Tregs to date has been centered on this subset. However, CD45RA+ Tregs are more prevalent in early life, with a high proportion of cord blood Tregs (∼75% in full-term cord blood) expressing this phenotype (14). It is of interest that human CD45RA+ Tregs expand readily in vitro, giving rise to a homogeneous Treg population, whereas some CD45RO+ Tregs lose their Foxp3 expression and suppressive capacity (15), suggesting that naive Tregs might play an important role in the maintenance of the Treg pool in adults. Recent work has suggested that CD45RA-expressing Tregs may be subdivided further into recent thymic emigrants (RTEs), which express the adhesion molecule CD31, and those that do not: these may have experienced some activation and/or proliferation in the periphery (16).
In this study, we set out to extend our previous work on the turnover of human Tregs in vivo (7, 9, 17) and to further explore the mechanisms of Treg maintenance in old humans. We made a number of novel observations: first, although CD45RO+ Tregs are extremely proliferative, with ∼20% in cycle at any given time, a far smaller proportion of CD45RA+ Tregs (∼2%) are in cycle. This is likely to be because the majority of proliferating CD45RA+ Tregs convert to CD45RO+ phenotype after activation. Second, we found that CD45RA+ and CD45RO+ Tregs have very distinct gene expression patterns, suggesting they may not be simply the same cells at different stages of differentiation. Finally, we show that CD45RA+ and CD45RO+ Tregs preferentially localize in different tissues, and this is related to their expression of different tissue-specific chemokine receptors. Taken together, these data suggest that human CD4+Foxp3+ Tregs in adults represent a heterogeneous population containing a mixture of thymic and peripherally induced regulatory cells. Furthermore, the composition of this pool shifts toward peripherally induced nTregs during aging. Finally, the different localization of these subsets in vivo indicates that they may exert their function at distinct sites in the body and that aging may be associated with preferential localization of nTregs in certain organs, such as the skin, that has been reported previously (18).
Materials and Methods
Subjects
Human peripheral blood was obtained directly from healthy donors within the age range 20–91 y or in the form of buffy coats (National Blood Service, Colindale, U.K.). Blood and bone marrow samples were obtained from healthy bone marrow donors by the Department of Hematology, University College London. All donors gave written informed consent and the work was approved by the Ethics Committee of the Royal Free Hospital (London, U.K.).
Isolation of cells
Blood was diluted with HBSS (Sigma-Aldrich, St. Louis, MO) and layered onto Ficoll-Paque (GE Healthcare, Buckinghamshire, U.K.) before centrifuging to isolate PBMCs. For sorting, CD4+ T cells were isolated from PBMCs using anti–CD4-conjugated magnetic beads and a MACS column (Miltenyi Biotec, Auburn, CA); the cells were then stained for CD25 and CD45RO and sorted using a FACSAria (BD Biosciences, San Jose, CA). Alternatively, CD4+CD25hi Tregs were isolated from PBMCs using a Treg isolation kit (Miltenyi Biotec), which was adjusted by inserting an extra step to remove memory (CD45RO+; directly conjugated microbeads), naive (CD45RA+; directly conjugated microbeads), or CD39+ (anti-CD39 FITC Ab [Ancell, Bayport, MN], 5 μl/100 μl, followed by anti-FITC microbeads) cells prior to CD25hi isolation.
Flow cytometry
Anti-human fluorescently conjugated mAbs were purchased from Abcam (Cambridge, U.K.) or Ancell (CD39 FITC), BD Biosciences (CD4 PerCP, CD25 PE-Cy7, CD45RA FITC, Ki67 FITC, CD31 PE, CCR4 PE, CLA FITC, CXCR4 PE, CTLA-4 PE, and IFN-γ allophycocyanin), Caltag Laboratories (Burlingame, CA) (CD45RA allophycocyanin), DakoCytomation (Carpinteria, CA) (CD45RO PE, CD45RO FITC), eBioscience (San Diego, CA), or Miltenyi Biotec (FOXP3 allophycocyanin) and R&D Systems (Minneapolis, MN) (IL-2 PE). Whole PBMCs or bone marrow was stained on ice with surface Abs; intracellular staining for Ki67, CTLA-4, and FOXP3 was performed using the eBioscience FOXP3 staining buffer kit to permeabilize the cells. Cells were then fixed in 2% paraformaldehyde and acquired on a FACSCalibur or BD LSR I (BD Biosciences). For Treg analysis, samples were first gated on CD4 and Foxp3 to identify Tregs and then subdivided into naive and memory based on the staining with either CD45RA or CD45RO. Analysis was performed using CellQuest (BD Biosciences) or FlowJo software.
Suppression assays
A total of 50,000 CD4+CD25− T cells were plated per well, in triplicate, alone or with an equal number of CD25hi Tregs added, in a 96-well round-bottomed plate. For suppression assays comparing naive and memory Tregs, CD45RA+CD25hi cells and CD45RO+CD25hi cells were isolated and added to CD4+CD25− at various ratios. Triplicates of 50,000 CD4+ cells alone and 50,000 CD4+CD25hi Tregs alone were also cultured for comparison. Cells were stimulated with either anti–CD3-/anti–CD28-coated beads (T cell expander beads; Dynal, Invitrogen Life Technologies, Carlsbad, CA) at 50,000 beads per well, or 1 μg/ml plate-bound anti-CD3 (OKT3) with irradiated PBMCs to provide costimulation. To investigate suppression of proliferation, after 3 d of culture at 37°C and 5% CO2 in complete medium (RPMI 1640 with 10% human serum), the plates were pulsed with [methyl-3H]thymidine (MP Biomedicals, Illkirch, France) and incubated for 16 h before being harvested onto filter mats and counted using a beta scintillation counter. To investigate suppression of cytokine production in cocultures, CD4+CD25− were first labeled with CFSE (1 μM) to allow the distinction between responder T cell (Tresp) and Treg populations and stimulated for 2 d as outlined above. A total of 50 ng/ml ionomycin and 250 ng/ml PMA were then added, and the cells were incubated for 3 h before brefeldin A (5 μg/ml) was added, and the cells incubated for an additional 2 h. The cells were then stained for IFN-γ and IL-2, before being acquired on a flow cytometer (FACSCalibur; BD Biosciences), using the gating on CFSE+ cells to examine cytokines produced by the responder population.
Immunohistochemistry
Punch biopsies (5 mm) of normal skin were obtained from the volar flexoral aspect of the forearm, cut, fixed in acetone, and frozen. Frozen sections were allowed to come to room temperature, washed in PBS, and then blocked using a protein block from DakoCytomation. Primary Abs (mouse IgG1 anti-CD4 and anti-Foxp3 biotin) were added in PBS and incubated overnight at 4°C in the dark. After additional washes, secondary fluorochrome-conjugated Abs (anti-mouse IgG-Alexa488 and strep-Cy3) were added in PBS and incubated for 45 min at room temperature in the dark. Slides were washed and mounted with Vectashield containing DAPI (Vector Laboratories, Burlingame, CA). Images were acquired using the appropriate filters on a Leica DMLB microscope with a ×40 objective, in conjunction with a Cool SNAP-Pro cf Monochrome Media Cybernetics camera and ImagePro PLUS 6.2 software.
T lymphocyte transendothelial migration
Normal nontransformed human dermal microvascular endothelial cells (HDMECs) (PromoCell, Heidelberg, Germany) derived from young human dermis were cultured at 37°C in a humidified 5% CO2, in endothelial cell basal medium supplemented with 5% FCS (supplement pack C39220; PromoCell, Heidelberg, Germany). Migration assays were performed as described previously (18). HDMEC monolayers were grown to confluency in 96-well plates and stimulated with TNF-α (110,000 U/ml) and IFN-γ (100 U/ml) for 24 h prior to migration assay. The T cell subsets to be investigated were isolated the day before the migration assay using MACS technology and incubated overnight, without stimulation, at 37°C and 5% CO2. They were then resuspended in serum-free medium (AIM-V; Invitrogen Life Technologies) at a concentration of 200,000 cells/ml. To perform the migration assays, endothelial monolayers were first washed with HBSS, then 100 μl cell suspension was added and incubated at 37°C for 2–4 h with a minimum of 6 wells per condition per experiment. After the requisite time had passed, the plate was placed in a culture chamber (37°C, 5% CO2) attached to a Zeiss Axiovert 200M light microscope. Time-lapse videos were obtained using a Hamamatsu Orca-ER digital camera and Simple PCI software, with images being taken every 10 s for 5 min. Recordings were replayed at 160 times normal speed, and lymphocytes that had migrated through the monolayer were identified and counted. Lymphocytes on the surface of the monolayer were identified by their highly refractive morphology (phase-bright) and rounded or partially spread appearance. In contrast, cells that had migrated through the monolayer were phase-dark and highly attenuated. Data were expressed as the percentage of total lymphocytes within a field that had migrated through the monolayer and a mean of six replicates was calculated.
Microarray analysis
RNA was extracted from six donor populations using the Ambion RNAqueous kit according to manufacturer’s instructions. The RNA was reverse transcribed and amplified by the SMART amplification method (BD Clontech, Palo Alto, CA). A microarray consisting of the Human Genome Array Ready Oligo Set version 4.0 (Operon catalog number 810532) was constructed using UltraGAPS slides (Corning Glass, Corning, NY). Data were acquired using a ScanArray Gx Plus (PerkinElmer, Wellesley, MA). All samples were run in parallel to a Universal Human Reference RNA sample (Stratagene, La Jolla, CA), which had been previously reverse transcribed. This facilitated comparison between samples. Donor samples and reference were labeled with Cy3 and Cy5, respectively (Bioprime Labeling Kit; Invitrogen Life Technologies). Hybridizations were carried out within Corning Hybridization Chambers overnight, using Lifter Slips (VWR International, West Chester, PA). Data normalization was performed using the Gene Expression Pattern Analysis Suite (www.gepas.org) (19), and the data were filtered by removing both the 20% lowest expressed genes and those showing an unsatisfactory coefficient of variation (>0.4).
Using log-normalized ratios, the TIGR Multiexperiment Viewer version 4.0 (2) was used to perform significance analysis of microarrays. Hierarchical clustering and principal component analysis were performed on the resultant gene list. Gene clusters were annotated by use of Database for Annotation, Visualization, and Integrated Discovery (DAVID) (20). Microarray data are available at www.ebi.ac.uk/arrayexpress; accession number E-MEXP-2372.
Statistics
The Student t test was used to analyze the differences in the means of data sets, paired where cells from the same donor were being compared or unpaired to compare between donors. Linear regression analysis was performed on age correlations.
Results
CD45RA+ (naive) Tregs decrease with age
To investigate the effects of aging on the Treg pool, we harvested PBMCs from healthy adult volunteers and investigated the proportion of Tregs expressing CD45RA and CD45RO receptors (henceforth, these will be referred to as naive and memory Tregs, respectively, for simplicity). In agreement with other studies, we find that in adults a low proportion of Tregs express CD45RA (Fig. 1A, 1B). Identifying Tregs by CD25hi (Fig. 1A) and Foxp3+ cells (Fig. 1B) expression gave similar results. It is of note that the intensity of Foxp3 expression is slightly lower on the CD45RA+ population (Supplemental Fig. 1) (21, 22). Both naive and memory Tregs express low levels of CD127 (Fig. 1C), a phenotypic characteristic of Tregs (13, 23). To further investigate the composition of the Treg pool in adult humans, we examined the expression of CD31, an adhesion molecule that has been proposed as a marker for RTEs (24). Although the naive nTreg pool is very small in adults, the majority (mean 70.3 ± 3.3%, n = 31) of these express CD31 (Fig. 1C), suggesting that a considerable proportion of these cells have been generated in the thymus.

The CD4+CD25hi Treg population contains both naive (CD45RA+) and memory (CD45RO+) cells. A, Dot plots showing representative staining of CD45RA+ and CD45RO+ cells within CD4+CD25− and CD4+CD25hi subsets. CD4+CD25hi cells are gated by selecting CD4+ cells with brighter CD25 expression than the brightest staining seen on non-CD4s (data not shown). B, Representative dot plot showing CD45RO and Foxp3 expression among CD4+ T cells. C, left panel, Representative histograms showing expression of the IL-7R (CD127) on CD45RA+ and CD45RO+ subsets of CD4+ Tregs (filled histograms) and responder CD4 T cells (unfilled histograms). Right panel, Representative histograms indicating expression of CD31 in CD45RA+ and CD45RO+ subsets of Tregs and responder CD4 T cells.
The CD4+CD25hi Treg population contains both naive (CD45RA+) and memory (CD45RO+) cells. A, Dot plots showing representative staining of CD45RA+ and CD45RO+ cells within CD4+CD25− and CD4+CD25hi subsets. CD4+CD25hi cells are gated by selecting CD4+ cells with brighter CD25 expression than the brightest staining seen on non-CD4s (data not shown). B, Representative dot plot showing CD45RO and Foxp3 expression among CD4+ T cells. C, left panel, Representative histograms showing expression of the IL-7R (CD127) on CD45RA+ and CD45RO+ subsets of CD4+ Tregs (filled histograms) and responder CD4 T cells (unfilled histograms). Right panel, Representative histograms indicating expression of CD31 in CD45RA+ and CD45RO+ subsets of Tregs and responder CD4 T cells.
The total proportion of the nTregs identified as CD4+CD25hi or as CD4+Foxp3+ increased significantly with age (Supplemental Fig. 2), which is in agreement with previous studies by ourselves and others (7, 8). However, the proportion of naive nTregs decreased during aging (age range 20–91 y, n = 53; p = 0.0018) (Fig. 2A). This mirrors the changes observed in the non-Treg pool (data not shown). There was a concomitant increase in the proportion of memory Tregs during aging (Fig. 2B). Although mean percentage of CD31-expressing cells within the naive Treg subset was 63% and did not significantly change with age (data not shown), the overall number of CD45RA+CD31+ Tregs decreased sharply, virtually disappearing by the age of 80 y (Fig. 2C). These data suggest that a proportion of circulating Tregs, even in older adults, are generated directly from the thymus; however, this population decreases significantly with age, presumably as a consequence of thymic involution.

Alterations in the composition of the Treg pool with age. PBMCs from healthy volunteers (n = 59, age range 21–91 y) were stained for surface marker expression and analyzed using flow cytometry. A, Graph of age-related change in the proportion of CD4+ Tregs expressing CD45RA. B, Graph showing change with age in the proportion of CD4+ Tregs expressing CD45RO. C, Graph showing change with age in the proportion of Tregs with RTE phenotype (CD45RA+CD31+).
Alterations in the composition of the Treg pool with age. PBMCs from healthy volunteers (n = 59, age range 21–91 y) were stained for surface marker expression and analyzed using flow cytometry. A, Graph of age-related change in the proportion of CD4+ Tregs expressing CD45RA. B, Graph showing change with age in the proportion of CD4+ Tregs expressing CD45RO. C, Graph showing change with age in the proportion of Tregs with RTE phenotype (CD45RA+CD31+).
Naive and memory Tregs are highly proliferative
The significant decrease in the numbers of naive Tregs with increasing age raises the issue of the contribution of these cells to the maintenance of the Treg pool in older individuals. It is clear that new naive Tregs cannot be produced at the same levels throughout life; therefore, the maintenance of the total Treg pool can be achieved by extensive turnover of the existing Tregs or by peripheral conversion of non-Tregs into Tregs (or the combination of these two mechanisms). We have previously shown that the memory Treg population is highly proliferative in vivo using deuterium labeling (7). However, small numbers of naive Tregs precluded the study of this subset using this method. In the current study, we extended our previous observations by measuring the proliferative activity of individual Treg subsets by their expression of Ki67, a protein expressed in the nucleus of cells during all stages of the cell cycle (17). PBMCs were stained ex vivo with CD4, Foxp3, CD45RO, and Ki67, gated on CD4+Foxp3+, and further subdivided into memory and naive subsets based on CD45RO staining (CD45RO− cells were assumed to be naive). In some experiments, CD25 staining was also included. We found that a very high percentage (mean 16.6 ± 1.3%, n = 18) of memory Tregs expressed Ki67, confirming that a large proportion of these cells were dividing at any given time (Fig. 3A, 3B). A smaller percentage of naive Tregs were also in cycle (mean 2.2 ± 0.4%, n = 18), which was significantly lower than the memory Treg pool. These results extend our previous observations on the proliferative rate of human Tregs considerably (7). A significantly lower proportion of CD4+CD45RO+ responder cells expressed Ki67 (mean 2.0 ± 0.2%, n = 18) compared with CD45RO+ Tregs, whereas Ki67 expression in naive CD4+ responder cells was virtually absent (mean 0.4 ± 0.1%, n = 18). Next, we investigated the proliferation of CD31+ and CD31− populations within the CD45RA+ Tregs; the CD45RA+CD31+ subset proliferated significantly more than the CD45RA+CD31− population (Fig. 3A, 3B) (means 2.87 and 1.54%, respectively, n = 18; p = 0.0427). One of the possibilities may be that the higher proliferation in the RTEs may be residual Ki67 expression resulting from turnover in the thymus.
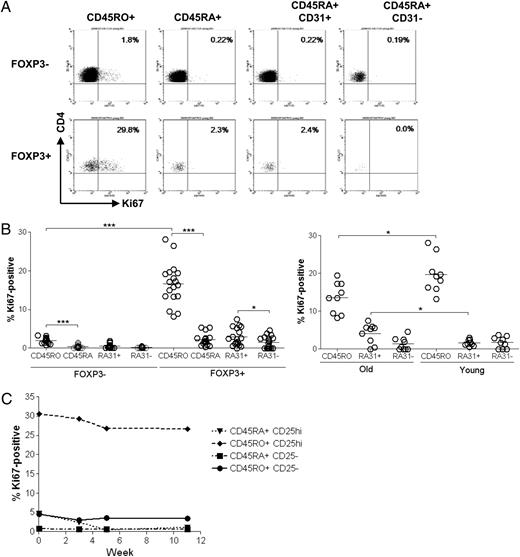
Both memory and naive Tregs are highly proliferative. PBMCs from healthy donors were stained for expression of the nuclear proliferation marker Ki67. Tregs were defined by gating on CD4+FOXP3+ cells. CD45RO+ cells were designated as memory and CD45RO- cells were assumed to be CD45RA+ and designated as naive. A, Representative dot plots showing Ki67 expression by CD45RO+, CD45RA+, CD45RA+CD31+, and CD45RA+CD31− Tregs and responders. B, left panel, Cumulative data showing the proportion of CD45RO+ and naive regulatory and responder cells in all age groups that stained positive for Ki67 (n = 37). Right panel, Ki67 expression by Treg subsets (CD45RO+, CD45RA+CD31+, and CD45RA+CD31−) in young (ages 22–35 y) and old (ages 71–91 y) (n = 9). C, Ki67 expression in Treg and responder subsets (CD45RO+ and CD45RA+) in three donors (ages 27, 31, and 38 y) over time.
Both memory and naive Tregs are highly proliferative. PBMCs from healthy donors were stained for expression of the nuclear proliferation marker Ki67. Tregs were defined by gating on CD4+FOXP3+ cells. CD45RO+ cells were designated as memory and CD45RO- cells were assumed to be CD45RA+ and designated as naive. A, Representative dot plots showing Ki67 expression by CD45RO+, CD45RA+, CD45RA+CD31+, and CD45RA+CD31− Tregs and responders. B, left panel, Cumulative data showing the proportion of CD45RO+ and naive regulatory and responder cells in all age groups that stained positive for Ki67 (n = 37). Right panel, Ki67 expression by Treg subsets (CD45RO+, CD45RA+CD31+, and CD45RA+CD31−) in young (ages 22–35 y) and old (ages 71–91 y) (n = 9). C, Ki67 expression in Treg and responder subsets (CD45RO+ and CD45RA+) in three donors (ages 27, 31, and 38 y) over time.
When we examined the proliferation of Treg subsets in different age groups, we found a decreased proportion of memory Tregs expressing Ki67 in the old (age range 71–91 y) compared with the young (age range 22–35 y) subjects (old, mean 13.6 ± 1.3%, n = 10; young, mean 19.7 ± 1.6%, n = 9) (Fig. 3B, right panel). Interestingly, there was significantly increased proliferation in the CD45RA+CD31+ Treg subset in the old (old, mean 4.1 ± 0.9%, n = 9; young, mean 1.7 ± 0.3%, n = 9) (Fig. 3B, right panel). In addition, we followed three healthy donors over a period of 3–4 mo and found a consistent level of Ki67 expression in all Treg and Tresp subsets over time (Fig. 3C).This suggests that a very high proportion of CD45RO+ Tregs are always in cell cycle, whereas CD45RA+ Tregs divide at a slower rate. Our data cannot exclude the possibility that although a high proportion of memory Tregs proliferate, this pool may also contain some cells that divide very slowly (25, 26).
We investigated whether CD45RA-expressing Tregs convert to CD45RO expression when they proliferate, as has been shown for responder cells (11). After several days of stimulation, naive Tregs begin to express CD45RO and concomitantly lose expression of CD45RA (Fig. 4A, 4B). By day 4 of stimulation, >70% of both Tregs and Tresps change their phenotype from exclusively CD45RA+ to CD45RO+ phenotype. This shows for the first time that upon entry into cell cycle after activation, naive Tregs lose their expression of CD45RA and become CD45RO+ and part of the memory Treg pool. Therefore, although present in small numbers in adults, naive Tregs can proliferate and contribute toward the maintenance of the memory Treg pool. However, the extent to which this occurs in old individuals is not clear at present.
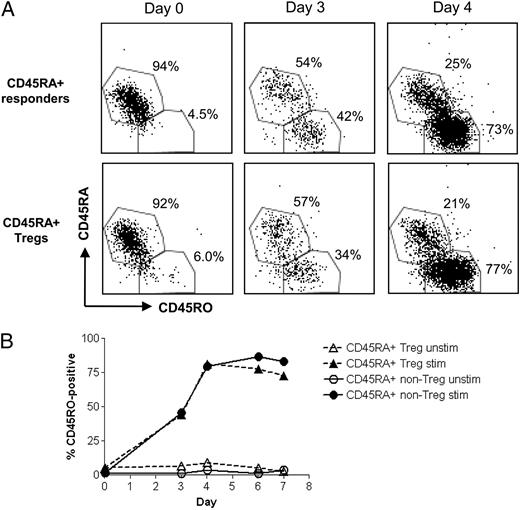
CD45RA+ Tregs acquire expression of CD45RO after stimulation in vitro. A, Dot plots showing expression of CD45RA and CD45RO by stimulated CD45RA+ Tregs and Tresps at days 0, 3, and 4 of in vitro stimulation with anti–CD3- and anti–CD28-coated beads. B, Graph showing CD45RO expression by CD45RA+ Tregs and responders over 7 d of in vitro stimulation, as above.
CD45RA+ Tregs acquire expression of CD45RO after stimulation in vitro. A, Dot plots showing expression of CD45RA and CD45RO by stimulated CD45RA+ Tregs and Tresps at days 0, 3, and 4 of in vitro stimulation with anti–CD3- and anti–CD28-coated beads. B, Graph showing CD45RO expression by CD45RA+ Tregs and responders over 7 d of in vitro stimulation, as above.
Naive and memory Tregs show distinct gene expression patterns
The present data and previous observations indicate that both thymus-derived naive Tregs and conventional CD4 T cells can contribute to the repopulation of the memory Treg pool in adult humans (2, 3, 9). It is currently not possible to distinguish between nTregs from peripherally induced Treg populations, and the relative contribution of cells from either of these sources to the total Treg pool is unclear (2, 3, 9). To further characterize the relationship between naive and memory Tregs, as well as Tregs and Tresps, we undertook global gene expression profiling of the four different subsets.
CD4 T cells were sorted into CD25hiCD45RA+ (naive Treg), CD25hiCD45RO+ (memory Treg), CD25−CD45RA+ (naive responder), and CD25−CD45RO+ (memory responder) populations. In these studies, naive Tregs were not further fractionated into CD31+ and CD31− populations because of the low cell numbers. RNA was extracted and amplified, and microarray analysis was performed. A significance analysis for microarrays was performed (using TIGR Multiexperiment Viewer, version 4.0) between all four populations eliciting a 121-gene list, with a false-discovery rate of 10%. Hierarchical clustering of the gene list provided five distinct gene clusters. The functions of the genes within these clusters were probed by applying the cluster lists to DAVID (20) annotating each cluster with details of Gene Ontology pathway associations. The CD45RA+ Treg population was clearly distinct from all of the other tested populations. Memory Tregs, memory responders, and naive responders all showed similar gene expression profiles to each other. Naive Tregs showed activation of genes in cluster A and inactivation of genes in clusters B and D (Fig. 5). All three other subsets showed approximately the reverse of this pattern, with naive responders showing the highest activation of clusters B and D. This suggests that naive Tregs may be a distinct population, whereas the other three subsets are related to each other. This is consistent with our previous hypothesis that a large proportion of memory Tregs in adults may be derived from Tresps (9), whereas CD45RA+ Tregs represent a distinct thymically derived population. We are currently investigating the functional implications of changes in expression of particular genes between the different Treg subsets.

Expression profile of naive Treg, naive responder, memory Treg, and memory responder populations. A, Relative expression of donor samples to reference for 121 significant genes. Colors indicate relative signal intensities. The expression profile was clustered hierarchically, clustering genes according to patterns of expression. Letter designations represent gene clusters used for DAVID pathway association. Full gene names and signal values are presented as additional data. B, Summation of gene cluster expression pattern across donor cell populations.
Expression profile of naive Treg, naive responder, memory Treg, and memory responder populations. A, Relative expression of donor samples to reference for 121 significant genes. Colors indicate relative signal intensities. The expression profile was clustered hierarchically, clustering genes according to patterns of expression. Letter designations represent gene clusters used for DAVID pathway association. Full gene names and signal values are presented as additional data. B, Summation of gene cluster expression pattern across donor cell populations.
Naive and memory Tregs have different phenotypes but have equal suppressive capacities
Despite intensive research, the exact mechanism of suppression used by Tregs has not been fully elucidated (1). Furthermore, it is not clear whether different populations of Tregs have distinct functions. To assess the functional similarities between CD45RA+ and CD45RO+ Tregs, we first compared their expression of surface molecules that have been previously shown to influence functional properties of Tregs. Numerous studies have implicated CTLA-4 as a mediator of Treg function in both humans and mice (27, 28). We found that CTLA-4 was expressed preferentially by CD45RO+ Tregs compared with CD45RA+ Tregs (mean 12.1 ± 1.22 and 4.2 ± 1.57%, respectively, n = 7; p = 0.0009 paired Student t test) (Fig. 6A, Supplemental Fig. 3A).
![FIGURE 6. Naive and memory Tregs have differing phenotypes but identical suppressive capacity. A, CTLA-4 expression by CD45RO+ and CD45RA+ regulatory and Tresps ex vivo (n = 7). B, Cumulative data showing CD39 expression by CD45RO+ and CD45RA+ Treg and Tresp subsets ex vivo (n = 8). C, Suppression of Tresp proliferation by CD45RO+ and CD45RA+ Tregs. Cells were isolated and added to CD25− Tresps. Experiments were performed in triplicate. Left panel, Representative suppression assay showing suppression of CD25− Tresps by both CD45RO+ and CD45RA+ Tregs at a 1:1 ratio. Right panel, Cumulative data showing percentage suppression of proliferation of responder cells by CD45RO+ or CD45RA+ Tregs, as measured by incorporation of [3H]thymidine after 3 d of culture. Incorporation by cultures with CD45RA+ or CD45RO+ Tregs was compared with incorporation by responder cells alone, and assays were performed at Treg/Tresp ratios of 1:1, 0.25:1, and 0.1:1. D, Suppression of Tresp cytokine production by CD45RO+ or CD45RA+ Tregs. Production of IL-2 and IFN-γ by responder cells was measured after culturing the cells alone and with added CD45RO+ or CD45RA+ Tregs. Cells were cultured for 2 d, before addition of brefeldin A and subsequent intracellular staining. Representative staining showing cytokine production in the absence and presence of CD45RO+ or CD45RA+ Tregs. Asterisks indicate significances, *p < 0.05; **p < 0.001; ***p < 0.0001.](https://aai.silverchair-cdn.com/aai/content_public/journal/jimmunol/184/8/10.4049_jimmunol.0903781/6/m_ji_0903781fig06.jpeg?Expires=1716294306&Signature=y50hE~ytcKKhnxkW9bpQKdXQSd36AkVDbArcYhMo4GKZua6-4y90KITPUOxXSlRxZdkiAcBCpvqC9LbZWbGMAh7kKfNEH5~R8cHsRcRjwgUKhKyogndXysrJr2tXdW~AEhvfgmSSdWSar5Ak23CNHmpl7~PhKRK3JpxJWRUrutYEBU0tEufJseZt1E-bR5qZ3V5K0Uw6pprG2rksnhYEgFOJY16sCXNslSM4v8amVjH4~4jZHOK3RO3G3ZB2i7n4cAWlXRnl7UEkZmQDT0AdpKMm2~zJT4RQfESrUsmr3EkIWAWbH0Y9MLGouQQ1QAKWan1ATuJOX2gcpABdDY~MNQ__&Key-Pair-Id=APKAIE5G5CRDK6RD3PGA)
Naive and memory Tregs have differing phenotypes but identical suppressive capacity. A, CTLA-4 expression by CD45RO+ and CD45RA+ regulatory and Tresps ex vivo (n = 7). B, Cumulative data showing CD39 expression by CD45RO+ and CD45RA+ Treg and Tresp subsets ex vivo (n = 8). C, Suppression of Tresp proliferation by CD45RO+ and CD45RA+ Tregs. Cells were isolated and added to CD25− Tresps. Experiments were performed in triplicate. Left panel, Representative suppression assay showing suppression of CD25− Tresps by both CD45RO+ and CD45RA+ Tregs at a 1:1 ratio. Right panel, Cumulative data showing percentage suppression of proliferation of responder cells by CD45RO+ or CD45RA+ Tregs, as measured by incorporation of [3H]thymidine after 3 d of culture. Incorporation by cultures with CD45RA+ or CD45RO+ Tregs was compared with incorporation by responder cells alone, and assays were performed at Treg/Tresp ratios of 1:1, 0.25:1, and 0.1:1. D, Suppression of Tresp cytokine production by CD45RO+ or CD45RA+ Tregs. Production of IL-2 and IFN-γ by responder cells was measured after culturing the cells alone and with added CD45RO+ or CD45RA+ Tregs. Cells were cultured for 2 d, before addition of brefeldin A and subsequent intracellular staining. Representative staining showing cytokine production in the absence and presence of CD45RO+ or CD45RA+ Tregs. Asterisks indicate significances, *p < 0.05; **p < 0.001; ***p < 0.0001.
Naive and memory Tregs have differing phenotypes but identical suppressive capacity. A, CTLA-4 expression by CD45RO+ and CD45RA+ regulatory and Tresps ex vivo (n = 7). B, Cumulative data showing CD39 expression by CD45RO+ and CD45RA+ Treg and Tresp subsets ex vivo (n = 8). C, Suppression of Tresp proliferation by CD45RO+ and CD45RA+ Tregs. Cells were isolated and added to CD25− Tresps. Experiments were performed in triplicate. Left panel, Representative suppression assay showing suppression of CD25− Tresps by both CD45RO+ and CD45RA+ Tregs at a 1:1 ratio. Right panel, Cumulative data showing percentage suppression of proliferation of responder cells by CD45RO+ or CD45RA+ Tregs, as measured by incorporation of [3H]thymidine after 3 d of culture. Incorporation by cultures with CD45RA+ or CD45RO+ Tregs was compared with incorporation by responder cells alone, and assays were performed at Treg/Tresp ratios of 1:1, 0.25:1, and 0.1:1. D, Suppression of Tresp cytokine production by CD45RO+ or CD45RA+ Tregs. Production of IL-2 and IFN-γ by responder cells was measured after culturing the cells alone and with added CD45RO+ or CD45RA+ Tregs. Cells were cultured for 2 d, before addition of brefeldin A and subsequent intracellular staining. Representative staining showing cytokine production in the absence and presence of CD45RO+ or CD45RA+ Tregs. Asterisks indicate significances, *p < 0.05; **p < 0.001; ***p < 0.0001.
Recent studies suggest that CD39 and CD73 may play a role in the mechanism of Treg suppression in both mice and humans (29, 30). We therefore investigated the expression of these molecules by the different human Treg subsets. We found that a high proportion of CD4+Foxp3+ Tregs expressed CD39 (mean 60.6 ± 4.0%, n = 17) (Fig. 6B). This was due to mainly to a large proportion (79.7 ± 1.7%, n = 8) of CD45RO+ Tregs that express CD39, whereas very few CD45RA+ human Tregs express this molecule (mean of 12.8 ± 2.8% [n = 8; p < 0.0001]) (Fig. 6B). Neither CD45RO+ nor CD45RA+ responder CD4 cells expressed significant levels of CD39 (CD45RO: mean 9.7 ± 1.4%; CD45RA+: mean 1.5 ± 0.6%; n = 8; data not shown). None of the CD4 T cell subsets expressed significant levels of CD73, and only a very small proportion of Tregs coexpressed CD39 and CD73 (Supplemental Fig. 3B). This is in contrast to previous studies in mice (30) and suggests that CD73 is unlikely to be involved in Treg function in humans.
We hypothesized that differences in expression of CD39 and CTLA-4 molecules in Treg function may result in differences in the suppressive ability of the two subsets. To test this, Tresps (CD4+CD25−) were stimulated with beads coated with anti-CD3 and anti-CD28, alone or in the presence of CD45RA+ or CD45RO+ Tregs at different ratios, and proliferation was measured after 3 d. We found that despite the phenotypic differences, CD45RA+ and CD45RO+ Tregs are equally capable of suppressing the proliferation of Tresps (Fig. 6C), in agreement with previous studies (12, 13). We also investigated the capacity of CD45RA+ and CD45RO+ Tregs to suppress production of the cytokines IFN-γ and IL-2 by Tresps (Fig. 6D). To do this, we cocultured the Treg subsets with responders in the presence of beads coated in anti-CD3 and anti-CD28 for 2 d; we then restimulated the cells with PMA and ionomycin for 5 h on day 2, in the presence of brefeldin A. We then stained for the presence of intracellular cytokines and analyzed the cells by FACS. No difference in suppression of either cytokine was observed between CD45RO+ and CD45RA+ Tregs; hence, it appears that both subsets of Tregs can suppress responder CD4+ T cells equally. One possible explanation is that naive Tregs rapidly upregulate CTLA-4 and/or CD39 once stimulated (akin to effector T cells, which upregulate these molecules following activation) and then exert suppressive activity. Alternatively, CD39 and pericellular adenosine generated by CD39 and CD73 (29, 30) are not critical for suppressive activity in vitro; although, we cannot exclude that they may contribute to suppression in more physiological conditions.
Naive and memory Tregs migrate to different tissues
The observation of such striking phenotypic differences, despite their apparent functional equivalence, raises the question to what extent the two Treg subsets perform the same role but at different sites in vivo. A number of studies have proposed that naive and memory Tregs express different homing molecules and migrate to different tissues in mice (31, 32). To clarify this further, we studied the localization of human CD45RA+ and CD45RO+ Tregs in tissues. We focused especially on their capacity to home to skin, which is often subject to inflammation and bone marrow, a primary lymphoid organ.
When we investigated the proportion of naive and memory Tregs in the bone marrow by staining with CD25, CD4, CD45RA, and CD45RO, we found a significantly increased proportion of CD45RA+ Tregs compared with the peripheral blood of the same donor and a correspondingly decreased proportion of CD45RO+ Tregs (Fig. 7A). Similar results were seen when staining with Foxp3 rather than CD25 (data not shown). This correlated with the expression of the bone marrow homing receptor CXCR4 (33), which was expressed on both CD45RO+ and CD45RA+ Tregs (Supplemental Fig. 4A) but was significantly higher on CD45RA+ Tregs (CD45RO+ Tregs: mean fluorescence intensity mean 16.0 ± 2.6, n = 11; CD45RA+ Tregs: mean 54.0 ± 12.4, n = 11; p = 0.0234). Furthermore, we found that proliferation of naive Tregs was similar in blood and bone marrow (bone marrow mean 4.2 ± 1 [n = 5], versus 5.0 ± 1.2 in peripheral blood). Interestingly, memory Tregs found in the bone marrow proliferate less than those in the peripheral blood (bone marrow mean 7.2 ± 0.7 [n = 5], compared to 13.4 ± 1.5 in peripheral blood) (Fig. 7B). One possible explanation is that naive Tregs proliferating in the bone marrow remain CD45RA+; this would suggest that bone marrow might act as a reservoir of naive Tregs.

Migratory potential of naive and memory Tregs. A, Bone marrow samples from healthy donors were analyzed by flow cytometry and compared with PBMCs from the same donors. Paired scatter plots are shown displaying percentage of CD25hi expressing CD45RA (left panel) or CD45RO (right panel) in blood and bone marrow samples from the same donors. B, Cumulative data showing ex vivo Ki67 expression by CD45RA+ and CD45RO+Foxp3+ and Foxp3- subsets from the peripheral blood and bone marrow of healthy donors (n = 6). C, Double immunofluorescence staining of representative biopsies from normal skin; CD45RO+ (green) and Foxp3+ (red) cells in a perivascular lymphocytic infiltrate. Foxp3+ cells are indicated by an arrow. Images were acquired using the appropriate filters on a Leica DMLB microscope with a ×40 objective, in conjunction with a Cool SNAP-Pro cf Monochrome Media Cybernetics camera and ImagePro PLUS 6.2 software. D, Cumulative data showing migration of Treg and Tresp subsets through stimulated and unstimulated endothelium in vitro (n = 4). Data were obtained using a Zeiss Axiovert 200M light microscope and Hamamatsu Orca-ER digital camera, in conjunction with SimplePCI software, to generate time-lapse videos of T cell movement in a live-cell chamber set at 37°C and 5% CO2.
Migratory potential of naive and memory Tregs. A, Bone marrow samples from healthy donors were analyzed by flow cytometry and compared with PBMCs from the same donors. Paired scatter plots are shown displaying percentage of CD25hi expressing CD45RA (left panel) or CD45RO (right panel) in blood and bone marrow samples from the same donors. B, Cumulative data showing ex vivo Ki67 expression by CD45RA+ and CD45RO+Foxp3+ and Foxp3- subsets from the peripheral blood and bone marrow of healthy donors (n = 6). C, Double immunofluorescence staining of representative biopsies from normal skin; CD45RO+ (green) and Foxp3+ (red) cells in a perivascular lymphocytic infiltrate. Foxp3+ cells are indicated by an arrow. Images were acquired using the appropriate filters on a Leica DMLB microscope with a ×40 objective, in conjunction with a Cool SNAP-Pro cf Monochrome Media Cybernetics camera and ImagePro PLUS 6.2 software. D, Cumulative data showing migration of Treg and Tresp subsets through stimulated and unstimulated endothelium in vitro (n = 4). Data were obtained using a Zeiss Axiovert 200M light microscope and Hamamatsu Orca-ER digital camera, in conjunction with SimplePCI software, to generate time-lapse videos of T cell movement in a live-cell chamber set at 37°C and 5% CO2.
In a previous study, we showed that CD4+Foxp3+ Tregs can be found in significant numbers in normal human skin, both before and after injection of Ag (18). These cutaneous CD4+Foxp3+ T cells expressed typical phenotypic and functional characteristics of regulatory cells (17). To investigate the phenotype of Tregs in the skin in terms of CD45RA and CD45RO expression, 5-mm skin sections were stained with Foxp3 and CD45RO and CD45RA Abs and examined using two-color immunofluorescence. We found that a vast majority of skin resident Tregs have a memory phenotype (95.4 ± 2.6%) (Fig. 7C). This was related to differences in chemokine receptor expression because both CLA and CCR4 were significantly higher in CD45RO+ compared with CD45RA+ Tregs, confirming previous reports (Supplemental Fig. 4B) (34).
We sought functional data to verify that memory Tregs showed preferential skin homing characteristics, as this had important implications for our previous studies, where we found higher proportions of these cells in the skin of older humans (18). We therefore used time-lapse phase-contrast microscopy to investigate the physical capacity of naive and memory Tregs to migrate across primary HDMECs in vitro (Fig. 7D). CD4 T cell migration was minimal when using resting endothelium (Fig. 7D). Activation of the HDMECs with TNF-α and IFN-γ stimulates E-selectin, ICAM-1, and VCAM-1 expression and allows efficient CD4+ T cell migration (18). In agreement with the expression of high levels of CLA, both CD45RO+ Tresps and CD45RO+ Tregs migrated equally well across the activated endothelium. In contrast, both CD45RA+ Tregs and naive Tresps migrated significantly less than the respective memory populations. Hence, the difference in the expression of skin homing molecules correlates well with the capacity to cross HDMECs in vitro.
Discussion
Tregs represent a heterogeneous population of CD4+ T cells, which are crucial in peripheral tolerance and control of immune responses to pathogens (1, 3). We and others have shown that despite reduced thymic output, Treg numbers are maintained and actually increase with age (5–8). A number of mechanisms could be responsible for this, including increased proliferation of thymic-derived Tregs, conversion of nonregulatory to Treg populations, or existence of long-lived Tregs. To establish the importance of the thymic-derived naive Treg for the maintenance of the Treg pool in old humans, we investigated the proliferation of each Treg subset in subjects in the different age groups. In addition, we compared differences in phenotype and function of these two Treg subsets with a view to inform on the closeness of their relationship. A number of novel observations were made: 1) proliferation rates of naive Tregs are significantly lower than for the memory Tregs, and naive Tregs acquire a memory phenotype as they proliferate; 2) naive and memory Tregs show a very different gene expression pattern; and 3) naive and memory Tregs express different chemokine receptors and preferentially localize in different tissues.
Until recently Tregs were thought to be generated solely in the thymus (reviewed in Refs. 2 and 3). However, because thymic output decreases with age, the source of these cells in later life has been an issue of some debate (2, 3). We previously demonstrated that human CD45RO+ Tregs represent a highly differentiated population’s, characterized by short telomeres, inability to upregulate telomerase and susceptibility to apoptosis (7). Therefore, these cells have limited capacity for self-renewal (7, 9), suggesting that it is unlikely that the Treg pool is maintained through continuous turnover of pre-existing CD45RO+ Tregs.
Several studies have suggested that CD4+Foxp3− T cells can acquire phenotypic and functional properties of Tregs in response to specific signals, such as TGF-β and retinoic acid (35, 36), or to subimmunogenic doses of agonist peptides (37). However, only a fraction (∼35%) of Treg signature genes are induced, indicating that from the genomic standpoint converted Tregs and thymus-derived Tregs are clearly different (2, 3). Our microarray analyses of Treg and Tresp subsets (Fig. 5) suggest that naive and memory Tregs represent essentially distinct populations, a hypothesis which is compatible with a significant contribution of converted Tregs to the memory Treg pool. Our previous data on the close clonal relationship between the subsets (7) and the close TCR homology between Tregs and Tresps described by other groups (38–40) also support the hypothesis that the process of peripheral conversion from non-Tregs plays a significant role in the maintenance of the Treg population in humans. A number of other studies have come to address the importance of the conversion in the Treg pool, with different conclusions. In nonimmunized and nonlymphopenic mice, conversion does not seem to play a significant role in the shaping of the peripheral Treg repertoire (41–43). However, the situation is likely to be different in humans, who undergo recurrent immunological challenges and have a much longer life span (2, 3, 9). In addition to peripheral conversion from responder cells, we do not rule out the possibility that the small number of naive Tregs that are present in older humans is driven by repeated divisions into the CD45RO+ Treg pool and contribute to the maintenance of these cells in adults.
In this study, we investigated the proliferative potential of naive Tregs for the first time. We found that the ratio of CD45RA+ (naive) to CD45RO+ (memory) Tregs decreased significantly with age confirming previous reports (12, 13). Interestingly, a large proportion of CD45RA+ Tregs in adults express CD31, a marker previously shown to be lost on activation and suggested to be expressed by RTEs (24, 44), suggesting some “new” Tregs may enter the periphery throughout life. However, there was a sharp decline in the number of CD31+CD45RA+ Tregs with increasing age, confirming that only a very small population of RTE Tregs are present in older humans (mean percentage of Tregs with RTE phenotype in donors > 70 y, 1.37 ± 0.26%, n = 10). Naive CD45RA+ Tregs proliferate significantly less than the CD45RO+ Tregs. The lower proliferation rate may be explained by the fact that on division they become CD45RO+ and disappear from the CD45RA+ pool. This is in agreement with a recent study by Miyara et al. (22) showing that there are two subsets of Tregs—resting and activated corresponding to naive and memory Tregs, respectively. In that study, resting Tregs become activated Tregs and then disappear quickly through apoptosis in agreement with our observation that memory Tregs represent a rapidly dividing population that is prone to apoptosis (7, 22). Furthermore, based on tracking of specific clonotypes, it was demonstrated that CD45RA+ Tregs and CD45RO+ activated Tregs represent distinct differentiation stages of the same T cell (22). However, the impact of age on this process was not addressed.
It is not clear how big the contribution of CD45RA+ Tregs to the maintenance of the total Treg pool is during aging. We are currently unable to distinguish between those cells within the memory Treg population that are recently converted from the naive pool and those that have been derived from responder cells. Furthermore, a lack of phenotypic markers that distinguish between natural and induced CD45RO+ Tregs makes it difficult to ascertain the relative contribution of these two mechanisms for Treg maintenance (3). In an attempt to further address this conundrum, we compared gene expression patterns for naive and memory Tregs, as well as naive and memory responders. The data show very distinct expression patterns between naive Tregs and all other subsets, again in agreement with the study by Miyara et al. (22). However, on the basis of our previous data, we suggest that this indicates that memory Tregs and thymically derived naive Tregs arise from different sources.
Finally, naive and memory Tregs express different chemokine receptors and therefore localize to different tissues. In particular, we find that expression of the skin homing molecules, CLA and CCR4, is restricted to circulating memory Tregs, and these cells can be identified in both normal and inflamed skin (17, 34). The localization of Tregs in the skin may be essential as the skin is constantly exposed to numerous antigenic challenges from the environment. It is of interest that the proportion of Tregs in the skin increases with age and can contribute to reduced immune responses observed in elderly individuals (18). Although we were not able to examine this, other human tissues, such as gut and lung, also reportedly contain significant numbers of Tregs (45, 46). From the available, data it appears that Tregs in these peripheral tissues also display a memory phenotype (31, 32, 47). An intriguing observation was that CD45RA Tregs express significantly more CXCR4 and accumulate preferentially in the bone marrow. The equivalent accumulation is not seen in the naive responders, although they also express relatively high levels of CXCR4. The significance of this observation is unclear, but it is known that the bone marrow can serve as a secondary lymphoid organ (48). It is possible therefore that the bone marrow may represent a niche where naive Tregs accumulate to mature, survive, and/or undergo homeostatic proliferation while maintaining their naive phenotype.
In conclusion, our studies re-enforce the hypothesis that the human Treg pool is heterogeneous and contains cells that may arise from the thymus and also from Tresps in the periphery. Furthermore, the source of cells that seed this pool changes with age and in older humans where the majority of these cells may be derived from Tresps (7, 40, 49). The differences in function and homing potential of distinct Treg subsets may relate to the specialized role of these cells, in particular tissue microenvironments. It is not clear at present whether this may have implications for reduced immune function that is associated with aging; however, we showed recently that the reduced cutaneous responses of older humans to challenge with recall Ags may be due in part to the presence of higher numbers of Tregs in their skin (18). It is well known that older individuals respond poorly to vaccination and have more frequent and more severe infections (50). It would be important to clarify whether the age-associated increase in Tregs contributes to this alteration in immunity.
Acknowledgements
We are grateful to all the volunteers who took part in this study. We thank Prof. John Greenwood and Prof. Nigel Klein for assistance and advice on microscopic analyses and Dr. Joanne Masters for expert cell sorting.
Disclosures The authors have no financial conflicts of interest.
Footnotes
This work was supported by grants from the Biotechnological and Biological Sciences Research Council (to A.N.A. and M.V.-S.), the British Skin Foundation (to A.N.A. and M.H.R.), and Dermatrust (to A.N.A. and M.H.R.).
The microarray data presented in this article have been submitted to the European Bioinformatics Institute (www.ebi.ac.uk/arrayexpress) under accession number E-MEXP-2372.
The online version of this article contains supplemental material.
