

Abstract
Galectin-1 (Gal-1) and galectin-3 (Gal-3) exhibit profound but unique immunomodulatory activities in animals but their molecular mechanisms are incompletely understood. Early studies suggested that Gal-1 inhibits leukocyte function by inducing apoptotic cell death and removal, but recent studies show that some galectins induce exposure of the common death signal phosphatidylserine (PS) independently of apoptosis. In this study, we report that Gal-3, but not Gal-1, induces both PS exposure and apoptosis in primary activated human T cells, whereas both Gal-1 and Gal-3 induce PS exposure in neutrophils in the absence of cell death. Gal-1 and Gal-3 bind differently to the surfaces of T cells and only Gal-3 mobilizes intracellular Ca2+ in these cells, although Gal-1 and Gal-3 bind their respective T cell ligands with similar affinities. Although Gal-1 does not alter T cell viability, it induces IL-10 production and attenuates IFN-γ production in activated T cells, suggesting a mechanism for Gal-1-mediated immunosuppression in vivo. These studies demonstrate that Gal-1 and Gal-3 induce differential responses in T cells and neutrophils, and identify the first factor, Gal-3, capable of inducing PS exposure with or without accompanying apoptosis in different leukocytes, thus providing a possible mechanism for galectin-mediated immunomodulation in vivo.
Effective immunological homeostasis relies on removal of activated leukocytes following inflammatory episodes (1, 2). Disruption of various homeostatic mechanisms responsible for leukocyte turnover results in a wide variety of human diseases ranging from autoimmunity to acute inflammatory-mediated tissue damage (1, 2, 3, 4). Many of these diseases remain refractory to current treatment options. In an effort to further understand regulatory mechanisms responsible for leukocyte homeostasis, we have searched for additional factors capable of regulating leukocyte turnover.
Leukocyte removal often requires the induction of apoptosis by effecter molecules such as Fas and TNF-α (2, 5, 6). However, several studies suggest that different leukocyte populations may have alternative routes for removal. Mice genetically deficient in either Fas or FasL exhibit lymphocytosis while maintaining normal neutrophil numbers (7). Patients with autoimmune lymphoproliferative disease, who also possess mutations in either Fas or FasL, likewise exhibit defects in lymphocyte removal while maintaining normal neutrophil numbers (8, 9). Acute inflammatory challenge in Fas- or FasLnull mice resolves normally (10), further suggesting that neutrophil removal at sites of active inflammation may occur through apoptosis-independent pathways. Consistent with this possibility, a significant percentage of phagocytosed neutrophils display no signs of apoptosis (11). Furthermore, transgenic mice expressing the antiapoptotic protein Bcl-2 in neutrophils display normal neutrophil numbers and exhibit no significant alterations in sensitivity toward phagocytosis (12). These results suggest that neutrophils and T cells likely possess distinct pathways for turnover.
Many studies demonstrate that members of the galectin family of β-galactoside-binding proteins are directly involved in regulating leukocyte function and turnover (13, 14, 15, 16, 17, 18, 19, 20, 21), but the molecular mechanism and pathways involved are not clear. Previous studies suggested that galectin-1 (Gal-1)3 primarily modulates immunity by inducing apoptosis in activated T cells (22, 23). However, these studies were confounded by the inclusion of the reducing agent DTT in treatment conditions (24, 25, 26), leaving questions concerning the mechanisms of galectin-mediated immunosuppression unanswered. Gal-1, Gal-2, and Gal-4 induce externalization of the membrane lipid, phosphatidylserine (PS), a common ligand for macrophage-mediated phagocytosis of apoptotic cells (26, 27, 28). The induction of PS in activated neutrophils by Gal-1, Gal-2, and Gal-4 occurs independently of apoptosis, but makes cells targets for phagocytosis (26, 29, 30), providing a possible mechanism of galectin-induced leukocyte turnover. These studies also provided the first pathway whereby neutrophils may be induced to undergo removal by apoptosis-independent pathways. However, Gal-1, Gal-2, and Gal-4 displayed no effect on T cell viability or PS exposure (26), further demonstrating the neutrophil-specific nature of nonapoptotic cell removal and also failing to explain at a mechanistic level the effects of galectins on T cells in vivo (13, 14, 15, 16, 17, 18, 19, 20, 21). Other studies have implicated other galectin family members in the regulation of T cell viability. Gal-3, one of the most well-studied members of this family (31), is thought to induce apoptosis in T cells, although these studies primarily used T leukemic cell lines (32, 33). In contrast to leukemic cell lines, several studies suggest that Gal-3 exhibits no effect on primary T cell viability (23, 34). Gal-1, Gal-2, and Gal-4 also induce PS exposure in several T leukemic cell lines, although this occurs in the absence of apoptosis (26). Because Gal-1, Gal-2, and Gal-4 fail to alter PS distribution or viability of primary activated T cells (26) and the effects of Gal-3 on primary T cell viability remain unclear (23, 33), we questioned whether Gal-3 modulates immune function by altering the viability of primary activated T cells.
In this study, we explored the signaling responses of neutrophils and T cells to Gal-1 and Gal-3 and the potential consequences of this signaling on cellular turnover and immune function in an effort to understand at a mechanistic level the effects of these protein in vivo (13, 14, 15, 16, 17, 18, 19, 20, 21). Previous studies examined the effect of Gal-1 under treatment conditions that included DTT (23). However, DTT can complicate these assays (23, 26, 35, 36, 37, 38). To eliminate artificial effects introduced by DTT inclusion (23, 26, 35, 36, 37, 38), while controlling for potential loss of Gal-1 activity, we stabilized Gal-1 with iodoacetamide which was previously shown to protect Gal-1 from oxidative inactivation (39, 40, 41, 42, 43, 44). In this study, iodoacetamide-treated Gal-1 (iGal-1) retained key biological activities previously documented for the unmodified protein (23, 26, 29, 45, 46, 47, 48), demonstrating that iGal-1 retains function while resisting oxidative inactivation. Furthermore, these results demonstrate that the failure of unmodified Gal-1 to induce apoptotic death in previous studies (26, 29, 30) was not a reflection of activity loss. By contrast, Gal-3, which does not require reducing conditions to remain active, induced PS exposure and apoptosis in primary activated T cells, while it induced PS exposure without accompanying apoptosis in activated neutrophils and in T leukemic cells, suggesting pathways whereby Gal-3 modulates leukocyte turnover in vivo. Taken together, these results provide mechanisms of Gal-1- and Gal-3-mediated immunomodulation and describe the first example of a single effector molecule, Gal-3, capable of inducing PS exposure in two separate leukocyte types with or without accompanying apoptosis.
Materials and Methods
Preparation of recombinant forms of human Gal-1 and Gal-3
The expression and purification of recombinant forms of human Gal-1 and Gal-3 were accomplished as outlined previously (26, 49). To stabilize Gal-1, Gal-1 was treated with 100 mM iodoacetamide in 100 mM lactose/PBS for 12 h at 4°C, similar to the method used previously (41). iGal-1 remained stable over prolonged periods of incubation at 37°C (at least up to 4 days). Gal-1 and Gal-3 were active following storage at −80°C over the duration of the study as assessed by the ability to rechromatograph the proteins over lactosyl-Sepharose before experimental use. Alexa Fluor 488-labeled forms of Gal-1 or Gal-3 were prepared using, respectively, Alexa Fluor 488 C5-maleimide or Alexa Fluor 488 carboxylic acid, succinimidyl ester, dilithium salt reactive dyes (Molecular Probes) as described (50). Following the labeling reaction, 14 mM 2-ME was added to Gal-1 or Gal-1 was alkylated as described above. To ensure use of active protein, Gal-1 and Gal-3 were rechromatographed over lactosyl-Sepharose and only lactose-eluted protein was used. Gal-3 was biotinylated by incubating Gal-3 (3 mg/ml) with 2 mM EZ-link Sulfo-NHS-LC-Biotin (sulfosuccinimidyl-6-(biotinamido) hexanoate; Pierce) for 2 h at 4°C.
Isolation, activation, and treatment of human cells
The isolation of neutrophils and T cells was in accordance with a protocol approved by the Emory Institutional Review Board. Seven separate healthy donors were used in this study to isolate neutrophils and T cells. Results shown in each experiment are representative of at least three independent experiments using at least three separate donors. Cells were isolated and activated as outlined previously (23, 26, 51). Briefly, for neutrophil isolation, heparinized blood obtained from normal donors was subjected to dextran sedimentation followed by hypotonic lysis and density gradient centrifugation using Histopague-1077 (Sigma-Aldrich). For activation, neutrophils were treated with 1 μM fMLP in HBSS/HSA for 10 min at 37°C. For T cells, fresh heparinized blood isolated as described for neutrophils was mixed in equal volume with HBSS (without Ca2+ or Mg2+) and subjected to density gradient centrifugation using Ficoll-Hypaque. Plasma and platelets were removed and lymphocytes were washed three times in HBSS, followed by resuspension at 1 × 10⁶ cells/ml in complete RPMI (RPMI 1640, 10% FBS, glutamine (2 mM), penicillin (100 mU/ml), and streptomycin (100 μg/ml)) and activated with 8 μg/ml PHA (Sigma-Aldrich) for ∼4 days as outlined previously (23, 26). T leukemic MOLT-4 cells were obtained from American Type Culture Collection and also maintained in complete RPMI. Leukocytes were treated with Gal-1, Gal-3, both, or IgM anti-Fas (200 ng/ml; Upstate Biotechnology) for the length of time and concentrations indicated in the figure legends and were analyzed for annexin V staining and cell fragmentation as outlined previously (24, 26). Cellular DNA fragmentation was assessed using the TUNEL reaction (In Situ Cell Death Detection kit; Roche Applied Science) or hypodiploid analysis as outlined previously (26, 52). Cells were stained with Gal-1 or Gal-3 by incubating 1 × 10⁶ cells/ml with 2 μg/ml Alexa Fluor-labeled Gal-1 or Alexa Fluor-labeled Gal-3 as indicated for 1 h at 4°C with the inclusion of 20 mM thiodigalactoside (TDG) or 20 mM sucrose as indicated. All samples were analyzed using CellQuest software with a minimum of 10,000 counts/sample. Ca2+ mobilization was measured as described previously (30). Relative viable cell number using the MTT assay was also determined as outlined previously (53).
Confocal microscopy
Cells were incubated with 2 μg/ml biotinylated Gal-3 and Alexa 488-labeled Gal-1 for 1 h at 4°C. After washing, cells were incubated with streptavidin Alexa Fluor 568 (Molecular Probes) for 1 h at 4°C. Cells were then plated on coverslips pretreated with poly-l-lysine (Sigma-Aldrich) and allowed to adhere for 30 min at 4°C. Cells were then fixed with 2% paraformaldehyde (PFH) buffered in PBS at 4°C for 2 h. Following fixation, cells were analyzed using a Leica TCS NT confocal microscope and Leica TCS software.
Cytokine detection
For stimulation of PBMC, 96-well plates (Costar) were precoated overnight at 37°C with anti-human CD3 (clone UCHT1, at 5 μg/ml) and anti-human CD28 (clone 28.2, at 1 μg/ml) (BD Pharmingen) in a volume of 50 μl/well. PBMCs obtained from three healthy volunteers were separately plated at 5 × 10⁵ cells/well (50 μl) in the presence or absence of Gal-1 (20 μM) and cultured for 24 h in 5% humidified CO2. TDG (20 mM) was added during the incubations to inhibit galectin binding. The following day, supernatants were harvested and submitted to cytokine analysis. IL-10 and IFN-γ levels were determined simultaneously by the human cytometric bead array (CBA) kit (BD Biosciences/BD Pharmingen), using a FACScan flow cytometer and CBA software (BD Biosciences).
Binding of Gal-1 and iGal-1 to glycans
Glycan microarrays were prepared essentially as described previously (54, 55). For galectin recognition of glycans on the printed glycan array, a solution of 20 μM Gal-1 or iGal-1 with or without 14 mM 2-ME, respectively, in PBS containing 0.005% Tween 20 was incubated for 1 h at 25°C. The glycan-derivatized slide was then immersed in PBS containing 0.005% Tween 20, drained, and then overlaid with FITC-streptavidin. After 1 h at room temperature in a dark humid chamber, the slide was washed by successive immersion in PBS/0.01% Tween 20 (three times) and water/0.1% Tween 20 (twice). The slide was briefly rinsed with distilled water and dried under microfiltered air. An image of bound fluorescence was obtained using a microarray scanner (Scan Array Express; PerkinElmer Lifer Sciences). The integrated spot intensities were determined using Metamorph software (Universal Imaging).
Cell-binding assays
T cells were isolated and activated as outlined above. Cell-binding experiments were accomplished as outlined previously (56). Briefly, following cellular activation, cells were biotinylated with NHS-LC-sulfo biotin (Pierce) according to the manufacturer’s protocol. Biotinylated cells were fixed in 2% PFH buffered in PBS (pH 7.4) at 4°C, followed by washing three times in PBS. Cells were incubated in streptavidin-coated 96 microtiter wells (Pierce) at 50 μl/well (2 × 10⁶ cells/ml). Cells were then incubated with Alexa 488 Gal-1 or Alexa 488 Gal-3, followed by washing three times and detection of binding using a PerkinElmer Victor (2) fluorometer with an excitation/emission pair of 488/535 nm. Analysis of binding isotherms and curve fittings was accomplished using Sigma Plot software.
Statistical analysis
Each data set shown is representative of data acquired from at least three separate experiments using cells isolated from at least three separate healthy donors. Results are expressed as mean ± SD. The statistical analyses were preformed using one- or two-way ANOVA, as indicated in the figure legends. Post-hoc comparisons were performed using Bonferroni’s test. All data were analyzed using Prism computer software (GraphPad). Differences were considered significant when p < 0.05.
Results
iGal-1 and Gal-3 induce PS exposure in activated neutrophils
We first sought to evaluate the potential action of iGal-1 and Gal-3 with activated neutrophils and effects on viability. To determine whether alkylation might alter the glycan-binding properties of Gal-1, we tested the binding of iGal-1 to a set of glycans used to previously define the relative affinity and specificity of Gal-1 (50, 56, 57). Gal-1 and iGal-1 exhibited similar binding patterns (Fig. 1, A and B), with no significant differences in glycan recognition (p > 0.05). As Gal-3 failed to display similar sensitivity to oxidative inactivation, we did not alkylate Gal-3 with iodoacetamide. We also wanted to confirm that iGal-1 signals PS exposure in neutrophils, similar to Gal-1, and whether this PS exposure occurs in the presence or absence of cell death (26, 29). Consistent with previous observations using Gal-1 (26, 29, 30), iGal-1 induced PS exposure in activated neutrophils (Table I and Fig. 1,C). TDG, a potent inhibitor of galectin-carbohydrate interactions, abrogated iGal-1-induced PS exposure (Table I). When treated with Gal-3, activated neutrophils also displayed significant PS externalization, which was likewise blocked by TDG inclusion (Table I). Activated neutrophils were also more sensitive then resting neutrophils to Gal-3 (data not shown), similar to previous results with Gal-1, Gal-2, and Gal-4 (26, 29, 30). These results demonstrate that like Gal-1, iGal-1 and Gal-3 induce PS exposure in activated neutrophils by a mechanism that requires carbohydrate recognition.

Gal-3 induces PS exposure in activated neutrophils. The binding of Gal-1 with 2-ME (A) or iGal-1 (B) to a representative panel of glycans is shown. Glycans are represented numerically as follows: 1) Galβ1-4GlcNAcβ1-2Manα1-3(Galβ1-4GlcNAcβ1-2Manα1-6)Manβ1-4GlcNAcβ1-4GlcNAc; 2) Neu5Acα2-3Galβ1-4GlcNAcβ1-2Manα1-3(Neu5Acα2-3Galβ1-4GlcNAcβ1-2Manα1-6)Manβ1-4GlcNAcβ1-4GlcNAcβ; 3) Neu5Acα2-6Galβ1-4GlcNAcβ1-2Manα1-3(Neu5Acα2-6Galβ1-4GlcNAcβ1-2Manα1-6)Manβ1-4GlcNAcβ1-4GlcNAc; 4) Galβ1-4GlcNAcβ1-2Manα1-3(Neu5Acα2-6Galβ1-4GlcNAcβ1-2Manα1-6)Manβ1-4GlcNAcβ1-4GlcNAc; 5) Galβ1-4GlcNAcβ1-3Galβ1-4GlcNAc; 6) GlcNAcβ1-4Galβ1-4GlcNAc; 7) Neu5Acα2-3Galβ1-4GlcNAcβ1-3Galβ1-4GlcNAc; 8) Neu5Acα2-6Galβ1-4GlcNAcβ1-3Galβ1-4GlcNAc; 9) Galβ1-4GlcNAc; and 10) Galβ1-4Glc. No significant difference was observed between Gal-1 and iGal-1 (p > 0.05). C, A representative facsimile of activated neutrophils treated for 8 h with either PBS (Vehicle), 20 μM iGal-1, or Gal-3 as indicated were analyzed for PS exposure by annexin V binding and PI exclusion. Percent of total cells in each quadrant is shown. D, Activated neutrophils treated with PBS (vehicle), 20 μM iGal-1, or Gal-3 for the indicated times were analyzed for PS exposure by annexin V binding and PI exclusion. Data are represented as mean values ± SD. *, p < 0.001 when comparing iGal-1 or Gal-3 to PBS; **, p < 0.05 when comparing Gal-3 to PBS (two-way ANOVA). E, Activated neutrophils treated with PBS (vehicle), iGal-1, or Gal-3 at the indicated concentrations for 8 h were analyzed for PS exposure by annexin V binding and PI exclusion. Data are represented as mean values ± SD. *, p < 0.001 or **, p < 0.01 when comparing iGal-1 to Gal-3. A value of p < 0.001 when comparing iGal-1 (1.9–15 μM) or Gal-3 (0.9–15 μM) to PBS (two-way ANOVA). F, Activated neutrophils were incubated with iGal-1-Alexa, iGal-1-Alexa + 25 mM TDG, and iGal-1-Alexa + 25 mM sucrose followed by flow cytometric analysis for binding. G, Activated neutrophils were incubated with Gal-3-Alexa, Gal-3-Alexa + 25 mM TDG, and Gal-3-Alexa + 25 mM sucrose followed by flow cytometric analysis for binding.
Gal-3 induces PS exposure in activated neutrophils. The binding of Gal-1 with 2-ME (A) or iGal-1 (B) to a representative panel of glycans is shown. Glycans are represented numerically as follows: 1) Galβ1-4GlcNAcβ1-2Manα1-3(Galβ1-4GlcNAcβ1-2Manα1-6)Manβ1-4GlcNAcβ1-4GlcNAc; 2) Neu5Acα2-3Galβ1-4GlcNAcβ1-2Manα1-3(Neu5Acα2-3Galβ1-4GlcNAcβ1-2Manα1-6)Manβ1-4GlcNAcβ1-4GlcNAcβ; 3) Neu5Acα2-6Galβ1-4GlcNAcβ1-2Manα1-3(Neu5Acα2-6Galβ1-4GlcNAcβ1-2Manα1-6)Manβ1-4GlcNAcβ1-4GlcNAc; 4) Galβ1-4GlcNAcβ1-2Manα1-3(Neu5Acα2-6Galβ1-4GlcNAcβ1-2Manα1-6)Manβ1-4GlcNAcβ1-4GlcNAc; 5) Galβ1-4GlcNAcβ1-3Galβ1-4GlcNAc; 6) GlcNAcβ1-4Galβ1-4GlcNAc; 7) Neu5Acα2-3Galβ1-4GlcNAcβ1-3Galβ1-4GlcNAc; 8) Neu5Acα2-6Galβ1-4GlcNAcβ1-3Galβ1-4GlcNAc; 9) Galβ1-4GlcNAc; and 10) Galβ1-4Glc. No significant difference was observed between Gal-1 and iGal-1 (p > 0.05). C, A representative facsimile of activated neutrophils treated for 8 h with either PBS (Vehicle), 20 μM iGal-1, or Gal-3 as indicated were analyzed for PS exposure by annexin V binding and PI exclusion. Percent of total cells in each quadrant is shown. D, Activated neutrophils treated with PBS (vehicle), 20 μM iGal-1, or Gal-3 for the indicated times were analyzed for PS exposure by annexin V binding and PI exclusion. Data are represented as mean values ± SD. *, p < 0.001 when comparing iGal-1 or Gal-3 to PBS; **, p < 0.05 when comparing Gal-3 to PBS (two-way ANOVA). E, Activated neutrophils treated with PBS (vehicle), iGal-1, or Gal-3 at the indicated concentrations for 8 h were analyzed for PS exposure by annexin V binding and PI exclusion. Data are represented as mean values ± SD. *, p < 0.001 or **, p < 0.01 when comparing iGal-1 to Gal-3. A value of p < 0.001 when comparing iGal-1 (1.9–15 μM) or Gal-3 (0.9–15 μM) to PBS (two-way ANOVA). F, Activated neutrophils were incubated with iGal-1-Alexa, iGal-1-Alexa + 25 mM TDG, and iGal-1-Alexa + 25 mM sucrose followed by flow cytometric analysis for binding. G, Activated neutrophils were incubated with Gal-3-Alexa, Gal-3-Alexa + 25 mM TDG, and Gal-3-Alexa + 25 mM sucrose followed by flow cytometric analysis for binding.
Gal-3 induces PS exposure in neutrophils and T cells in a carbohydrate-dependent fashion
| Treatment | Annexin V+/PI− (%)a | ||
|---|---|---|---|
| Neutrophils | T Cells | ||
| Control | 4 | 7 | |
| iGal-1 | 55 | 11 | |
| iGal-1 plus TDGb | 6 | 12 | |
| iGal-1 plus sucrose | 50 | 8 | |
| Gal-3 | 49 | 33 | |
| Gal-3 plus TDG | 7 | 13 | |
| Gal-3 plus sucrose | 45 | 38 | |
| Treatment | Annexin V+/PI− (%)a | ||
|---|---|---|---|
| Neutrophils | T Cells | ||
| Control | 4 | 7 | |
| iGal-1 | 55 | 11 | |
| iGal-1 plus TDGb | 6 | 12 | |
| iGal-1 plus sucrose | 50 | 8 | |
| Gal-3 | 49 | 33 | |
| Gal-3 plus TDG | 7 | 13 | |
| Gal-3 plus sucrose | 45 | 38 | |
Activated neutrophils or T cells were treated with 20 μM iGal-1 or Gal-3 for 8 h followed by detection for PS exposure. The data shown represent averages of duplicate determinations where the SE was <10%.
iGal-1 and Gal-3 were coincubated with either 20 mM TDG or sucrose as indicated.
Gal-3 induces PS exposure in activated T cells
To determine whether the induction of PS exposure by Gal-3 was specific to neutrophils, as previously observed for Gal-1, Gal-2, and Gal-4 (26), we explored the effect of Gal-3 on T cells. Gal-3 induced robust PS exposure in activated T cells (Table I). We also evaluated the response of T cells to iGal-1. Similar to previous observations with Gal-1 (26), iGal-1 displayed no effect on PS redistribution in T cells in parallel experiments (Table I). TDG inhibited Gal-3-induced PS exposure in T cells, indicating that the response requires carbohydrate recognition (Table I). Interestingly, Gal-3 failed to induce PS exposure in resting T cells (data not shown), indicating that T cell activation is required to prime cells to become responsive to Gal-3. These results demonstrate that, unlike Gal-1, Gal-2, or Gal-4 (26), Gal-3 induces PS exposure in activated T cells.
iGal-1 and Gal-3 induce PS exposure in the absence of apoptosis in activated neutrophils
Previous studies demonstrated that Gal-1, Gal-2, and Gal-4 induce PS exposure but not apoptosis in activated neutrophils (26, 58). Thus, we explored whether iGal-1 and Gal-3-induced PS exposure in activated neutrophils also occurred in the absence of apoptotic cell death. Both iGal-1 and Gal-3 induced maximal PS exposure in activated neutrophils following 4 h of treatment (Fig. 1,D). Furthermore, neutrophils exhibited a similar dose response following iGal-1 and Gal-3 treatment (Fig. 1,E), with neutrophils displaying a slightly more sensitive response to Gal-3 than iGal-1. Importantly, TDG, but not sucrose, inhibited both iGal-1 and Gal-3 binding to neutrophils, demonstrating that binding, like the signaling of PS exposure, required carbohydrate recognition (Fig. 1, F and G).
With an understanding of the dose response and kinetics of iGal-1- and Gal-3-induced PS exposure, we directly examined whether PS exposure in neutrophils induced by Gal-3 was accompanied by apoptosis. Although both iGal-1 and Gal-3 induced robust PS exposure in activated neutrophils (Table I), neutrophils treated with either iGal-1 or Gal-3 did not show DNA fragmentation as analyzed by both TUNEL assay (Fig. 2, A and B) and hypodiploid DNA content (Fig. 2,C). By contrast, parallel treatment of neutrophils with anti-Fas induced substantial apoptosis (Fig. 2, A–C). iGal-1 and Gal-3 also failed to induce cell shrinkage (Fig. 2,D) or increased membrane permeability as measured by propidium iodide (PI) staining (data not shown), which typically accompanies apoptosis in activated human neutrophils. Furthermore, iGal-1 and Gal-3 failed to accelerate the rate of spontaneous neutrophil apoptosis when evaluated at later time points (18 h; data not shown) or lower concentrations (10 μM; data not shown). Treatment of cells with anti-Fas, however, caused significant increases in late apoptosis (data not shown) and cell fragmentation (Fig. 2 D) in parallel assays. These results demonstrate that Gal-3, like Gal-1, induces PS exposure, but not apoptosis, in activated neutrophils.
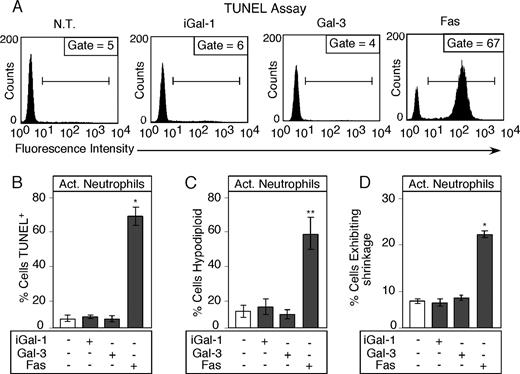
Gal-3 induces PS exposure in activated neutrophils in the absence of apoptosis. A, A representative facsimile of activated neutrophils treated with PBS (vehicle), 20 μM iGal-1, or Gal-3 for 8 h were analyzed for DNA fragmentation using the TUNEL assay. B, Quantitative analysis of DNA fragmentation in activated neutrophils treated with iGal-1 and Gal-3 using the TUNEL assay. C, Activated neutrophils treated with PBS (vehicle), 20 μM iGal-1, or Gal-3 for 8 h were analyzed for DNA fragmentation using hypodiploid analysis. D, Activated neutrophils treated with PBS (vehicle), 20 μM iGal-1, or Gal-3 for 8 h were analyzed for cellular shrinkage. Data are represented as mean values ± SD. B–D, Values of *, p < 0.001 or **, p < 0.01 comparing anti-Fas to PBS, iGal-1, or Gal-3 (one-way ANOVA). No significant difference was observed between iGal-1 or Gal-3 when compared with PBS (p > 0.05) in each experiment (B–D).
Gal-3 induces PS exposure in activated neutrophils in the absence of apoptosis. A, A representative facsimile of activated neutrophils treated with PBS (vehicle), 20 μM iGal-1, or Gal-3 for 8 h were analyzed for DNA fragmentation using the TUNEL assay. B, Quantitative analysis of DNA fragmentation in activated neutrophils treated with iGal-1 and Gal-3 using the TUNEL assay. C, Activated neutrophils treated with PBS (vehicle), 20 μM iGal-1, or Gal-3 for 8 h were analyzed for DNA fragmentation using hypodiploid analysis. D, Activated neutrophils treated with PBS (vehicle), 20 μM iGal-1, or Gal-3 for 8 h were analyzed for cellular shrinkage. Data are represented as mean values ± SD. B–D, Values of *, p < 0.001 or **, p < 0.01 comparing anti-Fas to PBS, iGal-1, or Gal-3 (one-way ANOVA). No significant difference was observed between iGal-1 or Gal-3 when compared with PBS (p > 0.05) in each experiment (B–D).
Gal-3, but not Gal-1, induces apoptosis in activated T cells
Because the above results demonstrate that Gal-3 induced PS exposure in the absence of cell death in neutrophils, we asked whether PS exposure induced in T cells reflects a common Gal-3-induced pathway between T cells and neutrophils and therefore also occurs in the absence of cell death. This is an important issue in light of a recent report that PS exposure can occur independently of apoptosis during T cell activation (59). To determine whether Gal-3 affects T cell viability, we assessed the dose response and kinetics of PS exposure in activated T cells. Unlike neutrophils, T cells treated with Gal-3 continued to display increased PS exposure over time, with significant PS exposure observed following 4 h of treatment (Fig. 3,A). Similar to the effects of Gal-3 on neutrophils, however, maximal PS exposure occurred at a concentration of ∼7 μM (Fig. 3,B), demonstrating a similar optimal concentration for PS exposure in these two cell types. In control experiments, iGal-1 had no effect on T cells over any time period tested or concentration used (Fig. 3, A and B), consistent with our earlier findings using Gal-1 (26). Importantly, TDG inhibited iGal-1 and Gal-3 binding to T cells (Fig. 3, C and D), demonstrating that T cells possessed ligands for both proteins, similar to previous studies on Gal-1 (23). Furthermore, iGal-1 induced PS exposure in MOLT-4 cells in parallel assays in a dose- and time-dependent manner (Fig. 3, E and F), as demonstrated previously for Gal-1 (26, 29), indicating that in these experiments iGal-1 was active and capable of signaling cells. Importantly, Gal-3 also induced PS exposure in MOLT-4 cells (Fig. 3, E and F).

Gal-3 induces PS exposure in activated T cells. A, Activated T cells treated with PBS (vehicle), 20 μM iGal-1, or Gal-3 for the indicated times were analyzed for PS exposure by annexin V binding and PI exclusion. Data are represented as mean values ± SD; *, p < 0.001 between Gal-3 and PBS (two-way ANOVA). No significant difference was observed between iGal-1 and PBS (p > 0.05). B, Activated T cells treated with PBS (vehicle), iGal-1, or Gal-3 at the indicated concentrations for 9 h were analyzed for PS exposure by annexin V binding and PI exclusion. Data are represented as mean values ± SD. *, p < 0.001 or **, p < 0.05 between Gal-3 and iGal-1 (two-way ANOVA). No significant difference was observed between iGal-1 and control (p > 0.05). C, Activated T cells were incubated with Gal-3-Alexa, Gal-3-Alexa + 25 mM TDG, and Gal-3-Alexa + 25 mM sucrose followed by flow cytometric analysis for binding. D, Activated T cells were incubated with iGal-1-Alexa, iGal-1-Alexa + 25 mM TDG, and iGal-1-Alexa + 25 mM sucrose followed by flow cytometric analysis for binding. E, T leukemic MOLT-4 cells treated with PBS (vehicle), 20 μM iGal-1 or Gal-3 for the indicated times were analyzed for PS exposure by annexin V binding and PI exclusion. Data are represented as mean values ± SD; *, p < 0.001 comparing Gal-3 or iGal-1 and PBS and also between Gal-3 and iGal-1 (two-way ANOVA). F, T leukemic MOLT-4 cells treated with PBS (vehicle), iGal-1, or Gal-3 at the indicated concentrations for 8 h were analyzed for PS exposure by annexin V binding and PI exclusion. Data are represented as mean values ± SD. *, p < 0.001 or **, p < 0.05 between Gal-3 and iGal-1; p < 0.001 when comparing iGal-1 (1.9–30 μM) or Gal-3 (0.9–30 μM) to PBS (two-way ANOVA).
Gal-3 induces PS exposure in activated T cells. A, Activated T cells treated with PBS (vehicle), 20 μM iGal-1, or Gal-3 for the indicated times were analyzed for PS exposure by annexin V binding and PI exclusion. Data are represented as mean values ± SD; *, p < 0.001 between Gal-3 and PBS (two-way ANOVA). No significant difference was observed between iGal-1 and PBS (p > 0.05). B, Activated T cells treated with PBS (vehicle), iGal-1, or Gal-3 at the indicated concentrations for 9 h were analyzed for PS exposure by annexin V binding and PI exclusion. Data are represented as mean values ± SD. *, p < 0.001 or **, p < 0.05 between Gal-3 and iGal-1 (two-way ANOVA). No significant difference was observed between iGal-1 and control (p > 0.05). C, Activated T cells were incubated with Gal-3-Alexa, Gal-3-Alexa + 25 mM TDG, and Gal-3-Alexa + 25 mM sucrose followed by flow cytometric analysis for binding. D, Activated T cells were incubated with iGal-1-Alexa, iGal-1-Alexa + 25 mM TDG, and iGal-1-Alexa + 25 mM sucrose followed by flow cytometric analysis for binding. E, T leukemic MOLT-4 cells treated with PBS (vehicle), 20 μM iGal-1 or Gal-3 for the indicated times were analyzed for PS exposure by annexin V binding and PI exclusion. Data are represented as mean values ± SD; *, p < 0.001 comparing Gal-3 or iGal-1 and PBS and also between Gal-3 and iGal-1 (two-way ANOVA). F, T leukemic MOLT-4 cells treated with PBS (vehicle), iGal-1, or Gal-3 at the indicated concentrations for 8 h were analyzed for PS exposure by annexin V binding and PI exclusion. Data are represented as mean values ± SD. *, p < 0.001 or **, p < 0.05 between Gal-3 and iGal-1; p < 0.001 when comparing iGal-1 (1.9–30 μM) or Gal-3 (0.9–30 μM) to PBS (two-way ANOVA).
Having determined the optimal dose response and time required for Gal-3-induced PS exposure in T cells, we explored whether PS exposure induced by Gal-3 was accompanied by cell death. Gal-3-induced PS exposure in T cells was accompanied by DNA fragmentation as demonstrated by increased TUNEL positivity (Fig. 4,A) and hypodiploid stain (Fig. 4,B). Gal-3-induced DNA fragmentation, like PS exposure, required carbohydrate recognition of cell surface receptors, and TDG, but not sucrose, blocked this effect (Fig. 4,A). Gal-3 also induced DNA fragmentation at lower concentrations, such as 10 μM (data not shown), consistent with the ability of Gal-3 to induce PS exposure at 10 μM (Fig. 3,B), while 10 μM iGal-1 had no effect on DNA fragmentation in parallel assays (data not shown). To further confirm that Gal-3-induced PS exposure and DNA fragmentation was accompanied by cell death, we directly examined cell viability using the MTT assay. Gal-3-treated cells demonstrated decreased conversion of the MTT substrate (Fig. 4,C), an indicator of cell viability (53), while iGal-1 failed to alter MTT conversion (Fig. 4,C). To determine whether PS exposure induced by Gal-3 was comparable to apoptosis induced by Fas, we treated cells with Gal-3 or Fas. Both Gal-3 and Fas induced apoptosis in activated T cells (Fig. 4 D). These results demonstrate that while Gal-3 induced PS exposure in the conspicuous absence of apoptosis in neutrophils, Gal-3 induced both PS exposure and cell death in T cells.

Gal-3 induces apoptotic PS exposure in activated T cells and nonapoptotic PS exposure in T leukemic MOLT-4 cells. A, Activated T cells treated with PBS (vehicle), 20 μM iGal-1, 20 μM iGal-1 + 25 mM TDG, 20 μM iGal-1 + 25 mM sucrose, 20 μM Gal-3, 20 μM Gal-3 + 25 mM TDG, or 20 μM Gal-3 + 25 mM sucrose for 9 h were analyzed for DNA fragmentation using the TUNEL assay. Data are represented as mean values ± SD; *, p < 0.01 and **, p < 0.05 (one-way ANOVA). No significant difference was observed between all iGal-1-treated samples, Gal-3 + 25 mM TDG, and PBS (p > 0.05). B, Activated T cells treated with PBS (vehicle), 20 μM iGal-1 or Gal-3 for 9 h were analyzed for DNA fragmentation using hypodiploid analysis. Data are represented as mean values ± SD. *, p < 0.01 (one-way ANOVA). No significant difference was observed between iGal-1 and PBS (p > 0.05). C, Activated T cells treated with PBS (vehicle), 20 μM iGal-1 or Gal-3 for 18 h were analyzed for cell viability using the MTT assay. Data are represented as mean values ± SD; *, p < 0.001 and **, p < 0.01 (one-way ANOVA). No significant difference was observed between iGal-1 and control (p > 0.05). D, Activated T cells treated with PBS (vehicle), 20 μM Gal-3, or 100 ng/ml α-Fas for 9 h were analyzed for DNA fragmentation using the TUNEL assay. Data are represented as mean values ± SD; *, p < 0.01 and **, p < 0.05 (one-way ANOVA). E, T leukemic MOLT-4 cells treated with PBS (vehicle), 20 μM iGal-1, 20 μM Gal-3, or 20 μM etoposide (Etop.) for 10 h were analyzed for PS exposure by annexin V binding and PI exclusion and cell death by annexin V binding and PI staining. Data are represented as mean values ± SD; *, p < 0.01 when comparing iGal-1 and PBS for PS exposure; **, p < 0.001 when comparing Gal-3 and PBS for PS exposure. Value of p < 0.01 when comparing Etop.-treated cells to iGal-1, Gal-3, and PBS for both PI staining and PS exposure (one-way ANOVA). No significant difference was observed between iGal-1, Gal-3, and PBS for PI staining (p > 0.05). F, T leukemic MOLT-4 cells treated with PBS (vehicle), 20 μM iGal-1, 20 μM Gal-3, or 20 μM Etop. for 10 h were analyzed for DNA fragmentation using hypodiploid analysis. Data are represented as mean values ± SD; *, p < 0.001 (one-way ANOVA). No significant difference was observed between iGal-1, Gal-3, and control (p > 0.05).
Gal-3 induces apoptotic PS exposure in activated T cells and nonapoptotic PS exposure in T leukemic MOLT-4 cells. A, Activated T cells treated with PBS (vehicle), 20 μM iGal-1, 20 μM iGal-1 + 25 mM TDG, 20 μM iGal-1 + 25 mM sucrose, 20 μM Gal-3, 20 μM Gal-3 + 25 mM TDG, or 20 μM Gal-3 + 25 mM sucrose for 9 h were analyzed for DNA fragmentation using the TUNEL assay. Data are represented as mean values ± SD; *, p < 0.01 and **, p < 0.05 (one-way ANOVA). No significant difference was observed between all iGal-1-treated samples, Gal-3 + 25 mM TDG, and PBS (p > 0.05). B, Activated T cells treated with PBS (vehicle), 20 μM iGal-1 or Gal-3 for 9 h were analyzed for DNA fragmentation using hypodiploid analysis. Data are represented as mean values ± SD. *, p < 0.01 (one-way ANOVA). No significant difference was observed between iGal-1 and PBS (p > 0.05). C, Activated T cells treated with PBS (vehicle), 20 μM iGal-1 or Gal-3 for 18 h were analyzed for cell viability using the MTT assay. Data are represented as mean values ± SD; *, p < 0.001 and **, p < 0.01 (one-way ANOVA). No significant difference was observed between iGal-1 and control (p > 0.05). D, Activated T cells treated with PBS (vehicle), 20 μM Gal-3, or 100 ng/ml α-Fas for 9 h were analyzed for DNA fragmentation using the TUNEL assay. Data are represented as mean values ± SD; *, p < 0.01 and **, p < 0.05 (one-way ANOVA). E, T leukemic MOLT-4 cells treated with PBS (vehicle), 20 μM iGal-1, 20 μM Gal-3, or 20 μM etoposide (Etop.) for 10 h were analyzed for PS exposure by annexin V binding and PI exclusion and cell death by annexin V binding and PI staining. Data are represented as mean values ± SD; *, p < 0.01 when comparing iGal-1 and PBS for PS exposure; **, p < 0.001 when comparing Gal-3 and PBS for PS exposure. Value of p < 0.01 when comparing Etop.-treated cells to iGal-1, Gal-3, and PBS for both PI staining and PS exposure (one-way ANOVA). No significant difference was observed between iGal-1, Gal-3, and PBS for PI staining (p > 0.05). F, T leukemic MOLT-4 cells treated with PBS (vehicle), 20 μM iGal-1, 20 μM Gal-3, or 20 μM Etop. for 10 h were analyzed for DNA fragmentation using hypodiploid analysis. Data are represented as mean values ± SD; *, p < 0.001 (one-way ANOVA). No significant difference was observed between iGal-1, Gal-3, and control (p > 0.05).
Gal-3 induces PS exposure independently of apoptosis in T leukemic cell lines
Because both iGal-1 and Gal-3 induced PS exposure in T leukemic cells (Fig. 3, E and F), yet only Gal-3 induced PS exposure in activated primary T cells, we next examined whether PS exposure induced in T leukemic cells by Gal-3 might also accompany cell death as observed in primary T cells. As a control, we also evaluated the effects of iGal-1 on MOLT-4 cells, as previous studies demonstrated that Gal-1 induces PS exposure in the absence of apoptosis in MOLT-4 cells (26, 29). Unlike the effects of Gal-3 on primary T cells, T leukemic MOLT-4 cells treated with Gal-3 did not show changes in viability as measured by increased PI stain (Fig. 4,E), although PS exposure was induced (Figs. 3, E and F, and 4,E). Gal-3 also failed to induce DNA fragmentation (Fig. 4,F) or alter cell growth (data not shown), although etoposide, a proapoptotic agent in these cells (29), induced apoptosis in parallel assays (Fig. 4, E and F). Similarly, iGal-1 also failed to induce apoptotic cell death in MOLT-4 cells as determined by the same indicators (Fig. 4, E and F). These results demonstrate that only Gal-3 induces PS exposure and apoptosis in activated primary T cells, while iGal-1 and Gal-3 induce PS exposure in activated neutrophils and a T leukemic MOLT-4 cells in the absence of cell death, similar to previous results for Gal-1 (26, 29).
iGal-1 does not modulate apoptosis induced by Gal-3 in activated T cells
Several studies have suggested that Gal-1 may modulate Gal-3-induced effects at the receptor level (34, 60), which led us to determine whether Gal-1 may modulate Gal-3-induced PS exposure in T cells. T cells treated with both iGal-1 and Gal-3 showed very little change in PS exposure when compared with Gal-3 alone (Fig. 5,A). iGal-1 also failed to alter the Gal-3 induction of cell death in T cells as measured by increased staining with PI (Fig. 5,B) or by DNA fragmentation assessed by the TUNEL assay (Fig. 5,C). Gal-3 induced PS more rapidly in MOLT-4 cells than iGal-1 (Fig. 3,E), suggesting, among several possibilities, faster kinetic on-rates for receptor engagement compared with iGal-1. To test this, we preincubated T cells for 30 min with iGal-1 to allow iGal-1 to bind receptors before the addition of Gal-3. Preincubation with iGal-1 did not significantly alter the ability of Gal-3 to induce cell death in T cells (Fig. 5 B). Similar results were obtained when incubating T cells with 10 μM iGal-1 and Gal-3 as outlined above (data not shown). These results suggest that Gal-1 and Gal-3 recognize distinct signaling receptors on the T cell surface that likely account for the unique ability of Gal-3 to induce apoptosis in T cells.
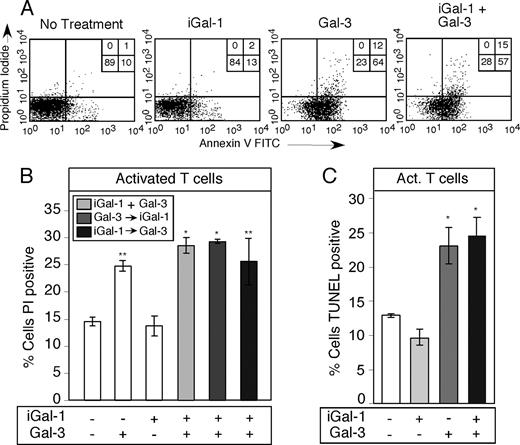
Gal-1 fails to alter Gal-3-mediated T cell apoptosis. A, A representative facsimile of activated T cells treated with 20 μM iGal-1, 20 μM Gal-3, or 20 μM iGal-1 + 20 μM Gal-3 for 9 h were analyzed for PS exposure by annexin V binding and PI exclusion. Percent of total cells in each quadrant is shown. B, Activated T cells treated with 20 μM iGal-1, 20 μM Gal-3, 20 μM iGal-1 + 20 μM Gal-3 (iGal-1 + Gal-3), and 20 μM iGal-1 for 30 min followed by 20 μM Gal-3 (iGal-1 → Gal-3) or 20 μM Gal-3 for 30 min followed by 20 μM iGal-1 (Gal-3 → iGal-1) for 9 h were analyzed for apoptotic cell death by staining with PI. Data are represented as mean values ± SD; *, p < 0.01 and **, p < 0.05 (one-way ANOVA). No significant difference was observed between iGal-1 coincubated with Gal-3 compared with Gal-3 alone (p > 0.05) or between iGal-1 and control (p > 0.05). C, Activated T cells treated with 20 μM iGal-1, 20 μM Gal-3, or 20 μM iGal-1 + 20 μM Gal-3 for 9 h were analyzed for DNA degradation using the TUNEL assay. Data are represented as mean values ± SD; *, p < 0.05 (one-way ANOVA). No significant difference was observed between iGal-1 coincubated with Gal-3 compared with Gal-3 alone (p > 0.05) or between iGal-1 and control (p > 0.05).
Gal-1 fails to alter Gal-3-mediated T cell apoptosis. A, A representative facsimile of activated T cells treated with 20 μM iGal-1, 20 μM Gal-3, or 20 μM iGal-1 + 20 μM Gal-3 for 9 h were analyzed for PS exposure by annexin V binding and PI exclusion. Percent of total cells in each quadrant is shown. B, Activated T cells treated with 20 μM iGal-1, 20 μM Gal-3, 20 μM iGal-1 + 20 μM Gal-3 (iGal-1 + Gal-3), and 20 μM iGal-1 for 30 min followed by 20 μM Gal-3 (iGal-1 → Gal-3) or 20 μM Gal-3 for 30 min followed by 20 μM iGal-1 (Gal-3 → iGal-1) for 9 h were analyzed for apoptotic cell death by staining with PI. Data are represented as mean values ± SD; *, p < 0.01 and **, p < 0.05 (one-way ANOVA). No significant difference was observed between iGal-1 coincubated with Gal-3 compared with Gal-3 alone (p > 0.05) or between iGal-1 and control (p > 0.05). C, Activated T cells treated with 20 μM iGal-1, 20 μM Gal-3, or 20 μM iGal-1 + 20 μM Gal-3 for 9 h were analyzed for DNA degradation using the TUNEL assay. Data are represented as mean values ± SD; *, p < 0.05 (one-way ANOVA). No significant difference was observed between iGal-1 coincubated with Gal-3 compared with Gal-3 alone (p > 0.05) or between iGal-1 and control (p > 0.05).
Gal-3 induces mobilization of intracellular Ca2+ in activated T cells
The above results demonstrate that both iGal-1 and Gal-3 can induce PS exposure independently of apoptosis in neutrophils. Thus, we explored whether iGal-1 and Gal-3 signal through common or distinct pathways in neutrophils. This question is important in light of recent evidence that Gal-1 and Gal-4 signal PS exposure independently of apoptosis in neutrophils through two separate pathways (26). To this end, we treated activated neutrophils with iGal-1 or Gal-3 and measured changes in intracellular Ca2+, which we showed previously to be required for Gal-1-induced PS exposure in these cells (30). iGal-1 and Gal-3 both induced Ca2+ flux in neutrophils (Fig. 6, A and B), suggesting a common pathway. To determine whether iGal-1 and Gal-3 might signal Ca2+ mobilization through a common receptor, we determined whether iGal-1 might block Gal-3 induced Ca2+ flux. We first tested whether iGal-1 could cause further Ca2+ release following a second treatment of cells with iGal-1. We observed that while the first treatment of cells with iGal-1 induced transient Ca2+ mobilization, the second treatment had no effect on Ca2+ flux (data not shown). This result suggests that either the iGal-1 receptors become saturated following initial treatment or that the signaling pathway becomes refractory to further stimulation. Similarly, we found that an initial treatment of cells with Gal-3 induced a transient Ca2+ mobilization, but a second treatment had no effect (data not shown). Importantly, neutrophils treated first with iGal-1 were insensitive to further stimulation by Gal-3 (Fig. 6,C). Because the responses of T cells and neutrophils to iGal-1 and Gal-3 were fundamentally different, we determined whether iGal-1 or Gal-3 mobilized Ca2+ in T cells. In contrast to the effects of iGal-1 on neutrophils, T cells treated with iGal-1 failed to mobilize Ca2+ (Fig. 6,D), whereas Gal-3 induced significant Ca2+ flux in T cells in parallel assays, which was sustained in T cells (Fig. 6,E). We also treated activated T cells with iGal-1, which was followed by treatment with Gal-3. However, iGal-1 failed to alter the sensitivity of T cells to Gal-3-induced Ca2+ mobilization (Fig. 6 F), further demonstrating that iGal-1 and Gal-3 recognize distinct receptors on the T cell surface. These results demonstrate that Gal-1 and Gal-3 recognize different receptors on the T cell surface and that Gal-3 initiates a signaling pathway in activated T cells that is not shared by Gal-1.
![FIGURE 6. Gal-3 induces Ca2+ mobilization in both activated neutrophils and activated T cells. Activated neutrophils treated with (A) 20 μM iGal-1, (B) 20 μM Gal-3, or (C) 20 μM iGal-1 followed by 20 μM Gal-3 were analyzed for changes in intracellular [Ca2+]. Activated T cells treated with (D) 20 μM iGal-1, (E) 20 μM Gal-3, or (F) 20 μM iGal-1 followed by 20 μM Gal-3 were analyzed for changes in intracellular [Ca2+].](https://aai.silverchair-cdn.com/aai/content_public/journal/jimmunol/180/5/10.4049_jimmunol.180.5.3091/4/m_zim0050866680006.jpeg?Expires=1716382233&Signature=mnMrUBwDwu9mIBmZgUpWI3GK0p5UhXaagPzpeAkpmo7wJihAgHPCGmMGM9aap9RId8fe6ugYdiWBAT2Q2zyXTFWz5LOQ82FQe7ud589Z61kVuSqUrNxibIgElMsTIBD-ZS102Ze7vq0oZa5v~Ktbm7SO0mnaR303yBUn4OVhczrB3wNSyHoU84fVHzz2Wr-WLFbXUcv925S8DjaayrU58wlUpHTmYyWdsI6puuh~RttmytxK1hyzf-Q7Pi9tus4WkjM15b8DZy-kKYCjm7tps6-N-3dQBsN10lSFezGUy~~UhS4n3zNDyAUV2R5VAPgZihD6ulNjY1SRJhpdYC9Nlw__&Key-Pair-Id=APKAIE5G5CRDK6RD3PGA)
Gal-3 induces Ca2+ mobilization in both activated neutrophils and activated T cells. Activated neutrophils treated with (A) 20 μM iGal-1, (B) 20 μM Gal-3, or (C) 20 μM iGal-1 followed by 20 μM Gal-3 were analyzed for changes in intracellular [Ca2+]. Activated T cells treated with (D) 20 μM iGal-1, (E) 20 μM Gal-3, or (F) 20 μM iGal-1 followed by 20 μM Gal-3 were analyzed for changes in intracellular [Ca2+].
Gal-3 induces Ca2+ mobilization in both activated neutrophils and activated T cells. Activated neutrophils treated with (A) 20 μM iGal-1, (B) 20 μM Gal-3, or (C) 20 μM iGal-1 followed by 20 μM Gal-3 were analyzed for changes in intracellular [Ca2+]. Activated T cells treated with (D) 20 μM iGal-1, (E) 20 μM Gal-3, or (F) 20 μM iGal-1 followed by 20 μM Gal-3 were analyzed for changes in intracellular [Ca2+].
iGal-1 and Gal-3 signal additive PS exposure in neutrophils
To further evaluate whether iGal-1 and Gal-3 signal through similar pathways in neutrophils, we treated neutrophils with iGal-1, Gal-3, or both galectins. Coincubation of activated neutrophils with iGal-1and Gal-3 induced PS exposure to a level that was similar to that observed with iGal-1 or Gal-3 alone (Fig. 7 A), further supporting the notion that iGal-1 and Gal-3 signal through a similar pathway in neutrophils.

Gal-3 and Gal-1 recognize separate ligands on the T cell surface. A, Activated neutrophils treated with 20 μM iGal-1low, 40 μM iGal-1high, 20 μM Gal-3low, 40 μM Gal-3high, 20 μM iGal-1 + 20 μM Gal-3 (iGal-1 + Gal-3), and 20 μM iGal-1 for 30 min followed by 20 μM Gal-3 (iGal-1 → Gal-3) or 20 μM Gal-3 for 30 min followed by 20 μM iGal-1 (Gal-3 → iGal-1) were analyzed for PS exposure by annexin V binding and PI exclusion. Data are represented as mean values ± SD; *, p < 0.001 between iGal-1, Gal-3, or iGal-1 and Gal-3 treated and PBS (one-way ANOVA). No significant difference was observed between iGal-1 and Gal-3high alone and coincubation of iGal-1 with Gal-3 (p > 0.05). B, Activated T cells were stained with iGal-1 and Gal-3 followed by detection for ligand localization by confocal analysis.
Gal-3 and Gal-1 recognize separate ligands on the T cell surface. A, Activated neutrophils treated with 20 μM iGal-1low, 40 μM iGal-1high, 20 μM Gal-3low, 40 μM Gal-3high, 20 μM iGal-1 + 20 μM Gal-3 (iGal-1 + Gal-3), and 20 μM iGal-1 for 30 min followed by 20 μM Gal-3 (iGal-1 → Gal-3) or 20 μM Gal-3 for 30 min followed by 20 μM iGal-1 (Gal-3 → iGal-1) were analyzed for PS exposure by annexin V binding and PI exclusion. Data are represented as mean values ± SD; *, p < 0.001 between iGal-1, Gal-3, or iGal-1 and Gal-3 treated and PBS (one-way ANOVA). No significant difference was observed between iGal-1 and Gal-3high alone and coincubation of iGal-1 with Gal-3 (p > 0.05). B, Activated T cells were stained with iGal-1 and Gal-3 followed by detection for ligand localization by confocal analysis.
Gal-1 and Gal-3 bind to distinct microdomains on activated T cells
Because the T cell response to iGal-1 and Gal-3 was fundamentally different and iGal-1 failed to attenuate Gal-3-induced T cell death, we examined the localization of iGal-1 and Gal-3 binding sites on the surface of activated T cells using confocal microscopy. Both iGal-1and Gal-3 bound to discrete microdomains on the cell surface (Fig. 7,B). Interestingly, the binding was largely to separate domains, although there was some overlap (Fig. 7 B). These studies were performed at 4°C, which limits the possibility of receptor reorganization. These results show that Gal-1 and Gal-3 recognize discrete receptors on T cells, and also recognize discrete microdomains on the T cell surface, further demonstrating that Gal-1 and Gal-3 have differential activities toward T cells.
Gal-1 and Gal-3 display similar affinities for T cell ligands
We next sought to examine the affinity of Gal-1 and Gal-3 toward T cell counter ligands. To accomplish this, we examined the binding of Gal-1 and Gal-3 toward T cells using a solid phase approach as described previously (56). Gal-1 and Gal-3 recognized T cells and recognition was inhibited by lactose, demonstrating carbohydrate-dependent recognition of T cell ligands (Fig. 8, A and B). Binding isotherms of Gal-1 (Fig. 8,C) or Gal-3 (Fig. 8,D) toward T cells revealed a similar binding affinity toward T cell surface ligands, with Gal-1 exhibiting a Kd of ∼4 μM and Gal-3 displaying a Kd of ∼2 μM (Fig. 8, C and D). Importantly, iGal-1 exhibited a similar affinity toward T cells as Gal-1 (data not shown). These results demonstrate that Gal-1 and Gal-3 recognize their respective counter receptors with similar affinity and strongly suggest that the inability of Gal-1 to inhibit Gal-3 induced PS exposure in T cells likely reflects discrete receptor recognition.

Gal-1 and Gal-3 recognize T cell ligands with similar affinity. A, T cells were incubated with 10 μM Alexa Flour 488-labeled Gal-1 with or without 0.1 M lactose as indicated followed by detection of bound Gal-1 using a fluorometer. B, T cells were incubated with 10 μM Alexa Flour 488-labeled Gal-3 with or without 0.1 M lactose as indicated followed by detection of bound Gal-3 using a fluorometer. Data are represented as mean values ± SD; *, p < 0.01 between Gal-1 or Gal-3 and PBS (one-way ANOVA). No significant difference between PBS and either Gal-1 or Gal-3 + lactose p > 0.05). Binding isotherms of (C) Alexa-Gal-1 and (D) Alexa-Gal-3 toward activated T cells.
Gal-1 and Gal-3 recognize T cell ligands with similar affinity. A, T cells were incubated with 10 μM Alexa Flour 488-labeled Gal-1 with or without 0.1 M lactose as indicated followed by detection of bound Gal-1 using a fluorometer. B, T cells were incubated with 10 μM Alexa Flour 488-labeled Gal-3 with or without 0.1 M lactose as indicated followed by detection of bound Gal-3 using a fluorometer. Data are represented as mean values ± SD; *, p < 0.01 between Gal-1 or Gal-3 and PBS (one-way ANOVA). No significant difference between PBS and either Gal-1 or Gal-3 + lactose p > 0.05). Binding isotherms of (C) Alexa-Gal-1 and (D) Alexa-Gal-3 toward activated T cells.
iGal-1 retains biological activity toward T cells
Although iGal-1 bound to T cell ligands (Figs. 3,C and 8, A and C), no changes in T cell viability occurred following treatment, similar to previous results with Gal-1 (26). Previous studies demonstrated that Gal-1 induces apoptosis in T leukemic cell lines and primary activated T cells in the presence of DTT. Although iGal-1 retained all the previously documented effects toward neutrophils, T cells, and leukemic T cells (Figs. 1–4) (26, 29, 30), we sought to determine whether iGal-1 might induce additional previously described biological endpoints in T cells. Similar to previous results with Gal-1 (24, 26, 46, 61, 62), iGal-1 induced apoptotic cell death in T leukemic CEM cells (Fig. 9, A and B) and MOLT-4 cells (data not shown) only in the presence of DTT in a dose-dependent manner (Fig. 9, A and B). Similarly, iGal-1 induced apoptotic cell death in primary T cells only when incubated in the presence of DTT (Fig. 9,C), consistent with previous findings using Gal-1 (23, 26). Few studies have examined the effects of Gal-1 in the absence of DTT. However, Gal-1 has been shown to increase IL-10 production and attenuate IFN-γ production in the absence of DTT (48). We next sought to determine whether iGal-1 induced the same effects. Similar to Gal-1 (48), iGal-1 induced increased IL-10 production while attenuating IFN-γ production (Fig. 9, D and E). Taken together, these results demonstrate that iGal-1 retains the function of Gal-1 toward T cells and neutrophils. As the inability of iGal-1 to inhibit Gal-3-induced apoptosis was a novel finding in this study, as a final control we determined whether Gal-1 also fails to inhibit Gal-3 induced apoptosis. Similar to iGal-1, Gal-1 failed to induce PS exposure or inhibit Gal-3-induced PS exposure (Fig. 9,F), DNA fragmentation or Ca2+ flux (data not shown) in T cells in the absence of DTT, although Gal-1 remained active over the treatment condition as indicated by its ability to induce PS exposure in MOLT-4 cells in parallel experiments (Fig. 9 F) and agglutinate T cells in the absence of Gal-3 over the duration of the experiment (data not shown). Taken together, these results demonstrate that Gal-1 and Gal-3 induce disparate effects in T cells while retaining the common ability to induce PS exposure independent of apoptosis in neutrophils.

iGal-1 retains biological activities toward T cells. A, T leukemic CEM cells were treated with 20 μM iGal-1 with or without DTT as indicated for 9 h following by assessing cell shrinkage by flow cytometric analysis. Data are represented as mean values ± SD; *, p < 0.001 or **, p < 0.01 (two-way ANOVA). No significant difference between iGal-1 and PBS (p > 0.05). B, T leukemic CEM cells were treated with 20 μM iGal-1 with or without DTT as indicated for 9 h following by assessing cell death by PI staining. Data are represented as mean values ± SD; *, p < 0.01 or **, p < 0.05 (two-way ANOVA). No significant difference occurred between iGal-1 and PBS (p > 0.05). C, Activated T cells or MOLT-4 cells were treated with 20 μM iGal-1 with or without 1.2 mM DTT as indicated. Data are represented as mean values ± SD; *, p < 0.001 (one-way ANOVA). No significant difference occurred between iGal-1 and control for activated T cells (p > 0.05). D, PBMCs or PBMCs treated with anti-CD3 and -CD28 (Act. T cells) were treated with 20 μM iGal-1 with or without 20 mM TDG as indicated followed by detection for IL- 10. Data are represented as mean values ± SD; *, p < 0.001 (one-way ANOVA). E, PBMCs or PBMCs treated with anti-CD3 and -CD28 (Act. T cells) were treated with 20 μM iGal-1 with or without 20 mM TDG as indicated followed by detection for IFN-γ. Data are represented as mean values ± SD; *, p < 0.001 (one-way ANOVA). F, Activated T cells or MOLT-4 cells were treated with 20 μM Gal-1, 20 μM iGal-1, 20 μM Gal-3, 20 μM Gal-1 + 20 μM Gal-3, or 20 μM iGal-1 + 20 μM Gal-3 for 9 h as indicated followed by analysis for PS exposure by annexin V binding and PI exclusion. Data are represented as mean values ± SD; *, p < 0.001 (one-way ANOVA). No significant difference occurred between Gal-1 + Gal-3 or iGal-1 + Gal-3 when compared with Gal-3 alone (p > 0.05) or between Gal-1 or iGal-1 and PBS (p > 0.05).
iGal-1 retains biological activities toward T cells. A, T leukemic CEM cells were treated with 20 μM iGal-1 with or without DTT as indicated for 9 h following by assessing cell shrinkage by flow cytometric analysis. Data are represented as mean values ± SD; *, p < 0.001 or **, p < 0.01 (two-way ANOVA). No significant difference between iGal-1 and PBS (p > 0.05). B, T leukemic CEM cells were treated with 20 μM iGal-1 with or without DTT as indicated for 9 h following by assessing cell death by PI staining. Data are represented as mean values ± SD; *, p < 0.01 or **, p < 0.05 (two-way ANOVA). No significant difference occurred between iGal-1 and PBS (p > 0.05). C, Activated T cells or MOLT-4 cells were treated with 20 μM iGal-1 with or without 1.2 mM DTT as indicated. Data are represented as mean values ± SD; *, p < 0.001 (one-way ANOVA). No significant difference occurred between iGal-1 and control for activated T cells (p > 0.05). D, PBMCs or PBMCs treated with anti-CD3 and -CD28 (Act. T cells) were treated with 20 μM iGal-1 with or without 20 mM TDG as indicated followed by detection for IL- 10. Data are represented as mean values ± SD; *, p < 0.001 (one-way ANOVA). E, PBMCs or PBMCs treated with anti-CD3 and -CD28 (Act. T cells) were treated with 20 μM iGal-1 with or without 20 mM TDG as indicated followed by detection for IFN-γ. Data are represented as mean values ± SD; *, p < 0.001 (one-way ANOVA). F, Activated T cells or MOLT-4 cells were treated with 20 μM Gal-1, 20 μM iGal-1, 20 μM Gal-3, 20 μM Gal-1 + 20 μM Gal-3, or 20 μM iGal-1 + 20 μM Gal-3 for 9 h as indicated followed by analysis for PS exposure by annexin V binding and PI exclusion. Data are represented as mean values ± SD; *, p < 0.001 (one-way ANOVA). No significant difference occurred between Gal-1 + Gal-3 or iGal-1 + Gal-3 when compared with Gal-3 alone (p > 0.05) or between Gal-1 or iGal-1 and PBS (p > 0.05).
Discussion
These results demonstrate that human neutrophils and T cells have distinct responses to Gal-1 and Gal-3, which may reflect differences between these leukocyte populations in their turnover and function. Gal-1 and Gal-3 exhibit robust and differential modulation of neutrophils and T cells, implicating this family as key regulators of both innate and adaptive immune responses. Furthermore, our data provide the first description of a single factor, Gal-3, capable of differentially inducing exposure of PS with or without apoptosis in two different leukocyte populations.
Gal-1 and Gal-3 are expressed in almost all tissues by many different types of cells (31, 63). Gal-3 is the Mac-2 Ag that is expressed constitutively on the surface of macrophages (64). Both galectins are expressed by fibroblasts, smooth muscle cells, skeletal muscle, neuronal cells, endothelial cells, and some lymphocytes, including T lymphocytes (31, 63). Gal-1 and Gal-3 are also up-regulated in response to inflammatory stimuli (31, 63). Thus, migrating neutrophils and T cells are likely to encounter these galectins during their normal movement into inflamed tissues. As a result, the effects of these galectins on neutrophils and T cells are likely relevant in many aspects of leukocyte biology, including trafficking, turnover, and the modulation of leukocyte responses during the course of inflammation.
Increasing evidence suggests that galectin family members possess key regulatory activities toward leukocytes with members exerting both overlapping and unique effects. Although Gal-1, Gal-2, Gal-3, and Gal-4 all induce apoptosis-independent PS exposure in neutrophils (26), only Gal-3 induces apoptotic cell death in activated T cells. Furthermore, only Gal-4 induces nonapoptotic PS exposure independent of intracellular Ca2+ mobilization in neutrophils (26), suggesting the existence of at least two separate pathways regulating nonapoptotic PS exposure. In contrast to the present study, previous results demonstrated that transient treatment of resting neutrophils with Gal-3 enhanced spontaneous apoptosis when analyzed following prolonged incubation (65). However, because high levels of free glycan are unlikely to efficiently disengage Gal-3 once bound to neutrophils, we felt that evaluating the effect of Gal-3 on neutrophil viability and PS exposure following continual treatment with Gal-3 would more appropriately reflect Gal-3 interactions with neutrophils in vivo. Indeed, previous studies demonstrated that cells actually require continual Gal-1-ligand engagement for full PS exposure to be realized (30). Uninterrupted binding may not only be required to sustain PS exposure, but also serve to signal the maintenance of cell viability. Future studies will evaluate this intriguing possibility.
It is likely that Gal-1 and Gal-3 share common receptors or a convergent signaling pathway in neutrophils, because preincubation with Gal-1 prevented further Ca2+ flux following incubation with Gal-3. In addition, coincubation of Gal-1 and Gal-3 caused additive, rather than synergistic, signaling responses in neutrophils. By contrast, activated T cells likely possess unique receptors and/or signaling pathways for Gal-1 and Gal-3, because Gal-1 did not attenuate the ability of Gal-3 to induce PS exposure and apoptosis in activated T cells. Furthermore, Gal-1 failed to block Gal-3-induced intracellular Ca2+ mobilization in activated T cells, which was sustained, unlike the transient Gal-1 and Gal-3 induced Ca2+ flux in neutrophils. The similar affinity of Gal-1 and Gal-3 toward their respective T cell counter ligands suggests that the inability of Gal-1 to alter Gal-3 likely results from recognition of different cell surface glycans. Gal-1 and Gal-3 also recognized discrete microdomains on activated T cells, further demonstrating differential recognition of T lymphocyte ligands. Consistent with this, recent studies demonstrate that Gal-1 and Gal-3 exhibit differential binding to T cell surface ligands (32, 66).
Earlier studies demonstrated that Gal-1 exhibited potent adaptive immunosuppressive activity toward the in vivo (13, 14, 15, 16). Subsequent studies suggested that Gal-1 may modulate the immune system by inducing cell death in activated T cells (23). The results of the present study suggest that the in vivo effects of Gal-1 may result from altered expression of IL-10 and IFN-γ in T cells as opposed to directly altering T cell viability, consistent with previous results (48). IL-10 exhibits potent immunosuppressive activity, inhibiting T cell activation and Th1 cytokine secretion and decreasing costimulatory receptors on APCs (67, 68). Gal-1 administration in vivo reduces Th1 responses (14, 69), and Gal-1null mice exhibit a Th2-biased responses (66). Additional regulatory mechanisms may be involved in Gal-1-mediated suppression of adaptive immune responses. CD4+CD25+ regulatory T cells from Gal-1null mice exhibit significantly compromised suppressive behavior (20) and Gal-1 itself induces FoxP3 expression in naive T cells (70). The ability of Gal-1 to induce IL-10 production, a key cytokine involved in regulatory T cell function (71), in both PBMCs and activated T cells may therefore reflect mechanisms whereby regulatory T cells suppress the immune system in vivo. Consistent with this, Blois et al. (72) recently demonstrated that Gal-1 requires IL-10 and regulatory T cell-mediated pathways in the maintenance of immunological tolerance at the maternal-fetal interface during early gestation. Interestingly, the first studies demonstrating that Gal-1 suppresses adaptive immunity suggested a role for suppressor T cells (13, 73, 74). These studies therefore suggest that Gal-1 suppresses adaptive immune responses by altering cytokine production without directly affecting T cell viability. Gal-4 also shows no effect on T cell viability (26, 58) yet exacerbates chronic colitis through increasing IL-6 production (58), and Gal-3 directly induces apoptosis in T cells. Such results suggest that galectins exert similar effects on activated neutrophils but unique and potentially opposing effects on T lymphocytes.
The ability of Gal-1, Gal-2, Gal-3, and Gal-4 to induce PS exposure independently of apoptosis in neutrophils, but not T cells, may be related to the unique selective pressures on neutrophils within a harsh inflammatory environment. The inflammatory milieu in which neutrophils neutralize pathogens or remove necrotic tissue is distinct from the inflammatory setting of T cells and may preclude these cells from maintaining membrane integrity for prolonged time between the induction of apoptosis and successful phagocytic removal. This may be especially important when considering that the number of neutrophils usually far exceeds the number of phagocytes that can remove them, especially during the early stages of acute inflammation (75). Indeed, neutrophil necrosis exacerbates the inflammatory response and may in part result from nonphagocytosed cells in late stages of apoptotic cell death (3, 76, 77, 78). In this setting, galectins released during neutrophil-mediated tissue damage may prepare cells for removal by signaling exposure of PS without inducing cell death, thus enabling these cells to maintain membrane integrity until successfully phagocytosed. Because T cells act in a more direct fashion, exhibiting Ag-specific immunity, similar selective pressures likely failed to convey the same avenue of removal for T cells (4).
The use of iGal-1 in this study allowed for the examination of Gal-1 function on leukocytes without introducing the deleterious effects of DTT inclusion in treatment medium (35, 36, 37, 38) while controlling for the potential loss of Gal-1 activity as a result of oxidative inactivation. Many studies have used iGal-1 to control for loss of Gal-1 activity to oxidative inactivation (39, 40, 41, 42, 43, 44). Previous studies demonstrated that iGal-1 retains quaternary structure and tertiary structure as measured by solution based small angle neutron and x-ray scatting compared with the crystal of the nonalkylated protein (43). Furthermore, iGal-1 retained the carbohydrate-binding specificity of Gal-1. More importantly, iGal-1 retained previously documented biological endpoints of Gal-1 activity on leukocytes, including the induction of PS exposure in activated neutrophils, MOLT-4 cells and CEM cells in the absence of cell death (26, 29, 30), the induction of Ca2+ flux in activated neutrophils (30), the induction of apoptosis in T cells, CEM cells and MOLT-4 cells in the presence of DTT (23, 24, 26, 46, 79) and the ability to alter T cell cytokine production (48). Taken together, these results demonstrate that iGal-1 retains the biological activities of the Gal-1. Equally important, these results also rule out the possibility that the failure of Gal-1 to induce apoptosis in neutrophils in previous studies reflected loss of activity during treatment (26, 29, 30). Importantly, Gal-1 failed to alter Gal-3-induced Ca2+ flux or cell death in T cells, similar to iGal-1, further demonstrating that alkylation fails to alter Gal-1 activity. Although DTT and iodoacetamide adduct formation are both artificial, the ability of iodoacetamide to stabilize Gal-1 will facilitate future studies of Gal-1 function while controlling for oxidative inactivation as done previously (39, 40, 41, 42, 43, 44) without introducing cells to an artificial reducing environment (35, 36, 37, 38).
The unique ability of galectins to signal PS exposure in living cells challenges current models of cell turnover and removal, which invoke only cellular apoptosis and necrosis. Galectin-induced cell removal could occur independently of cell death through the phagocytosis of living cells. We propose that this process be termed “preaparesis” (from the Latin preaparare), signifying that it prepares cells for phagocytic removal by causing PS exposure without accompanying apoptosis. We previously showed that Gal-1 induction of PS on activated human neutrophils correlated with their phagocytosis by activated macrophages (29). Consistent with the possible unique role of galectins in this pathway, only neutrophils undergo apoptosis-independent removal in vivo (12). Furthermore, genetic defects in classical apoptotic signaling pathways fail to alter neutrophil turnover in vivo (7, 10). Future studies should examine the role of galectins in leukocyte turnover in vivo and determine whether apoptosis-independent phagocytic removal is specific to neutrophils.
Acknowledgments
We thank Sandy Cummings for excellent technical support. We also thank Drs. Tongzhong Ju and Jamie Heimburg-Molinaro for helpful suggestions during the course of this work and critical reading of the manuscript.
Disclosures
The authors have no financial conflict of interest.
Footnotes
The costs of publication of this article were defrayed in part by the payment of page charges. This article must therefore be hereby marked advertisement in accordance with 18 U.S.C. Section 1734 solely to indicate this fact.
This work was supported by National Institutes of Health Grant P01 HL085607 (to R.P.M. and R.D.C.) and Swedish Research Council Grant 12165 (to H.L.).
Abbreviations used in this paper: Gal, galectin; TDG, thiodigalactoside; PS, phosphatidylserine; iGal, iodoacetamide-treated Gal; PFH, paraformaldehyde; PI, propidium iodide.
